Transport Reach Window
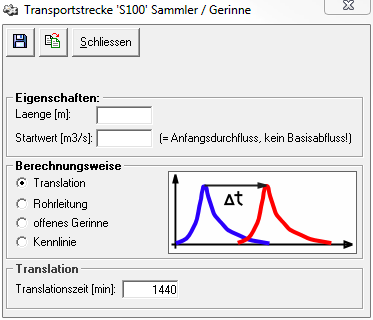
The data sheet for the transport route can be opened by double-clicking on the element symbol in the system plan 30px or by right-clicking -> Data Sheet.
In the upper part of the window there are three buttons for saving , for applying the parameters and settings from transport route elements in the same database (i.e. also from other variants and projects)
and for closing the window. It is important to know that the transport reach window also saves automatically when closing.
Properties
The length of the transport route and the start value for the discharge are entered in the Properties area.
File:Transport Route Window Properties.PNG
Calculation method
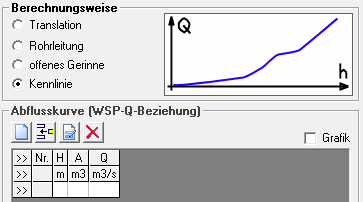
In the Calculation Method area, you can select how the translation and retention behavior is to be calculated in the transport reach element. There are four options for this:
- Pure translation (without retention)
- Free-flow pipe
- Open channel with defined cross-section geometry
- Characteristic curve (water level - cross-sectional area - discharge)
Translation
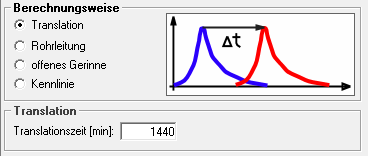
If the calculation method Translation is selected, only the Translation Time parameter is entered. The default setting is 1440 min, i.e. one day.
Pipeline
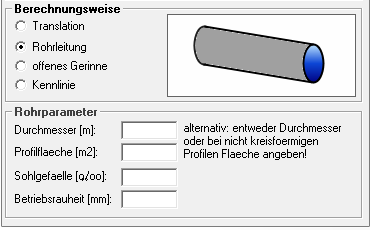
For the calculation of the transport distance as pipeline, information on the diameter, the bottom gradient and the operating roughness are required. If a sewer with a non-circular cross-section is to be calculated, the hydraulic diameter and the profile area (cross-section area when fully filled) are specified instead of the circular diameter.
=Open channel
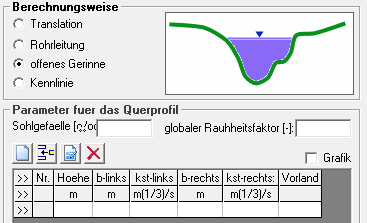
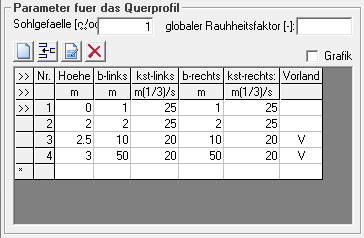
The calculation option open channel requires the specification of a cross section, each defined by a height, and the corresponding widths on the right and left. The Strickler values (kst) are entered separately for the right and left bank and it can be specified whether this support point is the channel itself or the foreland. For this purpose, the values can be simply written into the table area and it is possible to navigate through the table or to insert new lines with the arrow keys, the tab key or the enter key.
Alternatively, the function bar can be used to edit the table. You can:
- add new supporting points to the end of the table
- insert new supporting points in front of the currently marked supporting point
- edit a supporting point in an extra window
- delete the marked supporting point
By right-clicking on the table, a menu appears which can also be used to add, insert and delete rows.
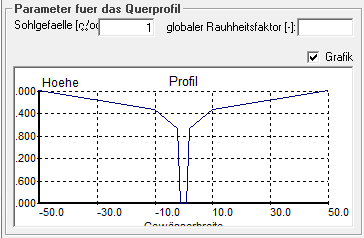
If you have entered a cross profile in the table, you can have it displayed as a graphic by checking the checkbox Graphic.
Characteristic Curve
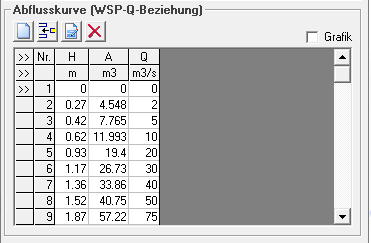
The calculation option characteristic curve requires the input of a discharge curve defined by several interpolation points consisting of water level, cross-sectional area and associated discharge.
For this purpose, the values can simply be written into the table area and you can navigate through the table or insert new rows using the arrow keys, the Tab key or the Enter key.
Alternatively, the function bar can be used to edit the table. You can:
- add new supporting points to the end of the table
- insert new supporting points in front of the currently marked supporting point
- edit a supporting point in an extra window
- delete the marked supporting point
By right-clicking on the table, a menu appears which can also be used to add, insert and delete rows.
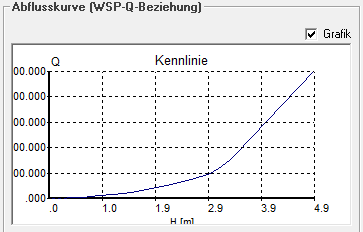
If you have entered a discharge curve in the table, you can have it displayed as a graphic by checking the Graphic box.
