Storage Window
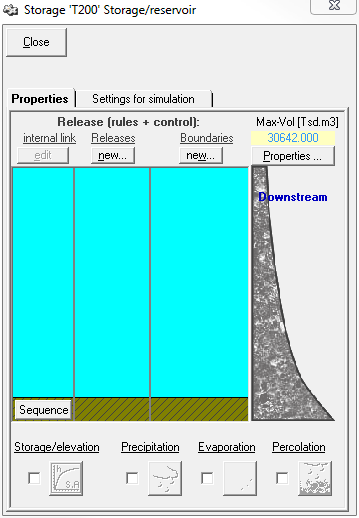
The properties for the storage can be opened by double-clicking on the element symbol in the system plan ![]() or by right-clicking → Properties.
or by right-clicking → Properties.
It has the two tabs Properties and Settings for simulation.
Properties
The properties tab of storage elements is divided into different sections (from top left to the bottom right):
- internal dependencies
- releases
- limits
- base data
- sequences
- rating curves
- loss/external contribution (precipitation, evaporation, infiltration)
In the following, these are discussed in the order in which they are reasonably processed.
Base Data
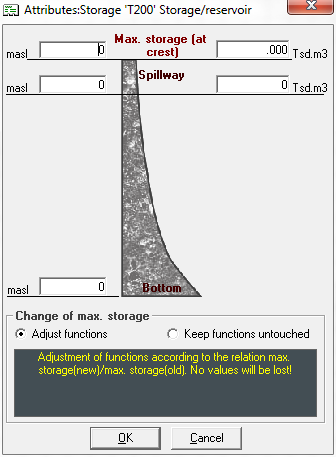
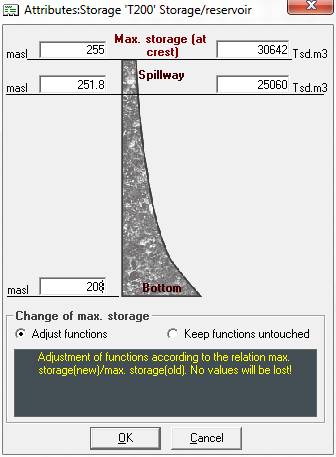
When creating a new storage for the first time, a window containing the base data describing the storage appears. Later, the window can be opened by clicking the button Base Data in the upper right corner of the storage window. The most important characteristics of the storage should be entered here.
The terms for storage elements are conceptualized for dams, as the system element was originally developed as a dam element. Thus, for dams, the height and the storage volume are entered for the following positions:
- Bottom (storage volume=0)
- Spillway
- Crest (maximum storage)
For all other storages, instead of the storage volume at crown height, a fictitious value can be specified as the maximum storage. This value will then never be exceeded in the model.
It is helpful to complete the base data right at the beginning and to adjust all additional functions in the storage element (e.g. rating curve, or function of the spillway) exactly to this base data. If the maximum storage is changed later, you can choose from two options at the bottom of the window on how to proceed with the additional functions of the storage element. Either the function values of all functions are adjusted according to the percentage change of the maximum storage volume or the function values are kept unchanged. Choosing the latter option, all supporting points larger than the new maximum storage volume are discarded. Whichever option is chosen, it is important to check all functions for coherence with the desired outcome!
Rating Curve
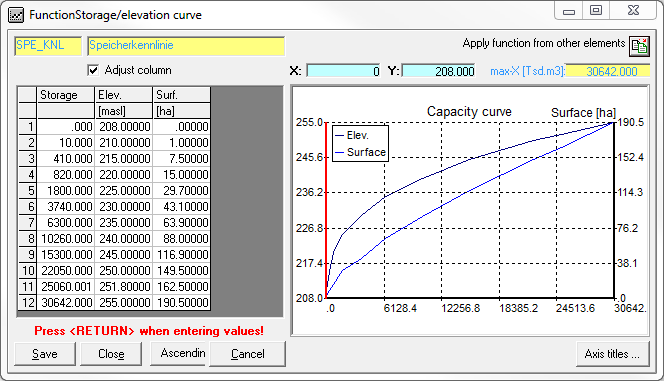
After entering the base data, it is reasonable to enter the rating curve next. To do this, activate the checkbox next to the (initially grayed out) symbol for the rating curve at the bottom left of the window. Later, the rating curve can be edited by clicking the
icon. Deactivating the check box deletes the rating curve again.
The rating curve compares the storage volumes in the storage with the respective water levels and the water surface. When entering the data, it is important to note that the height and storage volume data must be consistent with the positions for the bottom, spillway and crown that have been entered in the base data section. The first supporting point is always storage volume: 0 | height: bottom height | surface: 0. The last supporting point is storage volume: maximum storage | height: crown height | surface: corresponding maximum surface.
Release
Creating a New Release
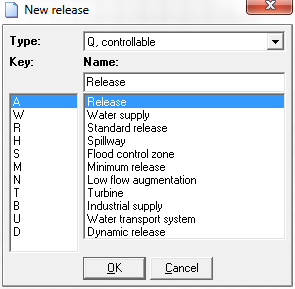
To create a new release, click the button Create new release in the section Releases of the storage window. Afterwards a window appears, in which the class and the type of the release can be selected and a corresponding name can be assigned.
The class of the release can be chosen from Q, adjustable release and K, non adjustable release. The following options are available:
| Identifier | Term EN | Term DE |
|---|---|---|
| A | Release | Abgabe |
| W | Water supply | Wasserversorgung |
| R | Standard release | Regelabgabe |
| H | Spillway | Hochwasserentlastung |
| S | Flood control area | Hochwasserschutzraum |
| M | Minimum release | Mindestabgabe |
| N | Low flow augmentation | Niedrigwasseraufhöhung |
| T | Turbine | Turbine |
| B | Industrial supply | Brauchwasser |
| U | Water transport system | Überleitung |
| D | Dynamic release | Dynamische Abgabe |
The selection of type, class and name is mainly informative. The user himself is responsible for entering the data for releases afterwards. The identification of the release is made up of three digits: the first letter is determined by the selected class, the second by the selected type. These are then followed by a unique number in the third position, which is assigned corresponding to the order of the creation of the releases and their classes and types. The release identifier determines how the simulation results are stored and how the releases can be utilized for the definition of system states. For this purpose, the release identifier is attached to the respective system element identifier with an underscore, e.g., T100_QA1.
After the delivery has been created, a box with the respective release identifier appears in the memory window in the section Releases.
Editing Releases
An already created release can be edited by double-clicking the box showing the release ID in the Release section or by right-clicking the box → Edit. A new window opens.
Enabling/Disabling Releases
At the left of the release ID box there is a checkbox that can be used to activate and deactivate the release. Disabled releases are not taken into account in the simulation.
Deleting Releases
A release can be deleted by right-clicking on the release identifier to open the context menu and to select delete.
Outlets
Newly created releases do not yet have an outlet from the storage. Therefore an allocation to an outlet has to be established first. If the storage element in the flow network map is already connected to other system elements, the connected elements and their identifiers appear in the Outlet section on the right side of the window. A release is now assigned to an outlet by connecting them via drag&drop. To do this, drag (by holding a left-click) the box with the release identifier onto the box with the outflor identifier. The created connection is displayed with an arrow. Similarly, an existing connection can be deleted. One outlet can be comprised of several releases.
Limits
Creating New Limits
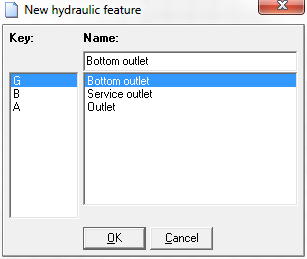
To create a new limit for a hydraulic feature, click the button Create new limit in the storage window in the Limits section. After that a window appears in which the identification of the limit can be selected and a name assigned.
The following limit types are available for hydraulic features:
| Identifier | Term EN | Term DE |
|---|---|---|
| G | Bottom outlet | Grundablass |
| B | Service outlet | Betriebsablass |
| A | Outlet | Auslass |
The selection of the type and the input of the designation is mainly informative and does not affect the calculation. The identification of limits is made up of three digits: the first letter is always "G", the second is determined by the selected type. These are then followed by a unique number in the third position, which is assigned corresponding to the order of the creation of the limits and their classes and types.
After the limit has been created, a box with the respective identification of the limit appears in the storage window in the section Limits.
Editing Limits
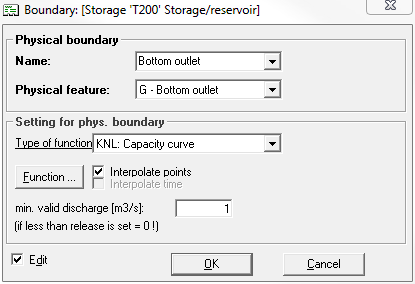
An already created limit can be edited by double-clicking on the identifier box in the limits section or by right-clicking on the identifier → Edit. A new window opens for this purpose:
Here the minimally permitted outflow flowing through the hydraulic features can be entered. After clicking the Function button, the storage-outflow-function can also be entered as a limit function.
Assigning a Release to a Limit/ Deleting Allocations
A release can be assigned to a limit by drag&drop. For this purpose, the box with the release identifier is dragged onto the box with the limit identifier. The connection is displayed with an arrow. Similarly, the connection can be deleted again.
Deleting Limits
To delete a limit, right-click on the boundary and select → Delete from the context menu.
Internal Dependencies
Creating New Internal Dependencies
To create a new internal dependency of two releases, connect the two releases by dragging and dropping. To do this, drag the box with the release identifier providing the condition for the reduction onto the box with the release identifier modified by the reduction. The connection is represented by an arrow. One release can reduce several other releases, for this purpose several connections are created from this release.
Editing Internal Dependencies
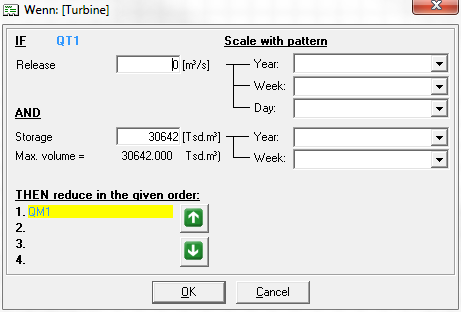
To edit an already created internal dependency, first select the release providing the condition for the reduction and then click the button Edit. Alternatively, after right-clicking on the release, select → Edit internal dependency from the context menu. After that a window appears.
In the appearing window you can enter the value that the release must exceed and the storage volume must fall below in order to trigger a reduction of the other releases. The entry is made as a constant value,and, if necessary, scaled with a hydrograph, which can be selected from the corresponding drop-down lists. At the bottom of the window the arrow buttons can change the order in which the releases are to be reduced.
The order in which the releases are to be reduced can also be adjusted in the window that opens when you click the Sequence button from the save window.
Loss/ External Contribution
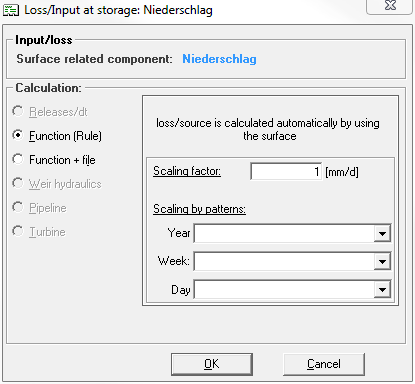
External contributions/ losses affecting the storage in the form of precipitation, evaporation and infiltration can be entered in the lower section of the storage window. For this purpose, the checkbox next to the respective symbol is activated and a new window appears. This window can also be opened later by clicking on the symbol of the loss/contribution.
Calculation method
The loss/contribution term can be entered either as a constant hydrograph (Attention: Labelling in the GUI: Function (Btr.Rule)) or as a time series (Attention: Labelling in the GUI: Function + File), if necessary scaled with a factor. Regardless of the selected calculation method, the internal loss/contribution of the storage is automatically scaled with the current storage surface.
Simulation settings
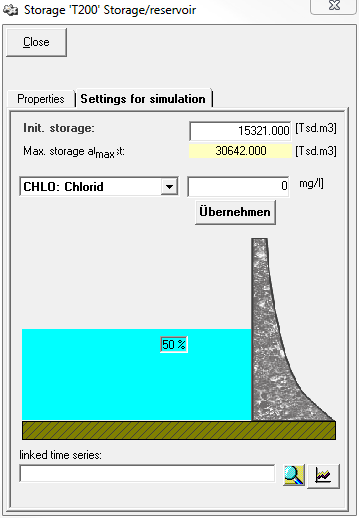
In the Settings for simulation tab of the storage window, the initial conditions for the storage are set:
The initial storage storage volume [Tsd.m³] can be entered in a text field. For orientation, the maximum storage volume of the storage element is shown directly below. Puting in the initial storage volume will alter the graphic in the middle of the section corresponding to the fill level of the dam automatically and the fill level is displayed in percent.
For all substances already defined, the initial concentration [mg/l] is specified here. To do this, the substance is selected from the drop-down list and the initial concentration is entered in the text field next to it. It is important to click the Apply button afterwards, otherwise the entry will be lost when closing. If the button is not clicked after the change, a message window still appears, but the Yes button is inactive, i.e. it is not saved.
At the bottom of the window there is a section to read the starting value for the initial storage volume from a time series. At the start of the simulation the value in the time series is set as the starting value for the initial storage volume. The selection of the time series from the time series management is done via the button Selection ![]() . Via the button Display
. Via the button Display ![]() a window with a graphic of the time series opens.
a window with a graphic of the time series opens.
