Einzugsgebietsfenster/en: Unterschied zwischen den Versionen
Ferrao (Diskussion | Beiträge) (Die Seite wurde neu angelegt: „The selection of the time series is done with the button ''Selection'' Datei:Button_Zeitreihe_zuordnen.png|Datei:…“) |
Ferrao (Diskussion | Beiträge) (Die Seite wurde neu angelegt: „constant hydrograph can be connected via their respective selection menus and can be deleted with the DELETE-key. By…“) |
||
| Zeile 87: | Zeile 87: | ||
The selection of the [[Special:MyLanguage/Zeitreihenverwaltung|time series]] is done with the button ''Selection'' [[Datei:Button_Zeitreihe_zuordnen.png|Datei:Button_Zeitreihe_zuordnen.png]]. The button ''Display'' [[Datei:Button_Zeitreihe_anzeigen.png|Datei:Button_Zeitreihe_anzeigen.png]] opens a window with the [[Special:MyLanguage/Grafikfenster|time series graphics]]. | The selection of the [[Special:MyLanguage/Zeitreihenverwaltung|time series]] is done with the button ''Selection'' [[Datei:Button_Zeitreihe_zuordnen.png|Datei:Button_Zeitreihe_zuordnen.png]]. The button ''Display'' [[Datei:Button_Zeitreihe_anzeigen.png|Datei:Button_Zeitreihe_anzeigen.png]] opens a window with the [[Special:MyLanguage/Grafikfenster|time series graphics]]. | ||
[[Special:MyLanguage/Ganglinienfenster| | [[Special:MyLanguage/Ganglinienfenster|constant hydrograph]] can be connected via their respective selection menus and can be deleted with the DELETE-key. By clicking the button ''Show chart'' [[File:Button_Ganglinie_ anzeigen.png|File:Button_Ganglinie_ anzeigen.png]], the [[Special:MyLanguage/Ganglinienfenster|hydrograph window]] opens, where the chart can be edited directly. It is important to note that the hydrograph can also be connected at other places in the model and that the changes are valid everywhere. If you want to modify a chart only for the current catchment area, a copy has to be created and connected before. | ||
Version vom 28. Oktober 2020, 16:05 Uhr
The data sheet for the catchment area can be opened by double clicking on the element symbol in the system plan 30px or by right clicking -> Data sheet.
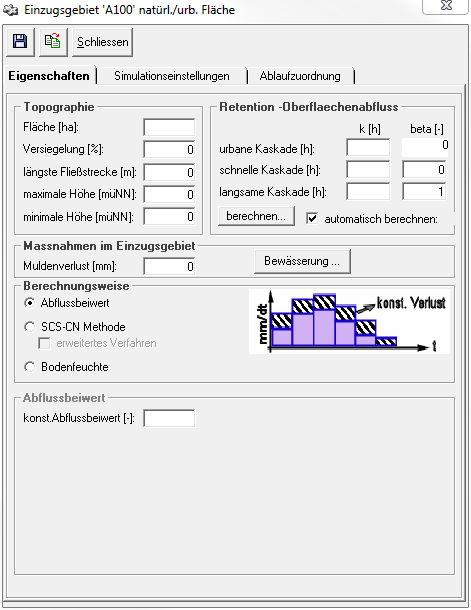
It has the three tabs Properties, Simulation Settings and Sequence Assignment. In the upper part of the window there are also three buttons for saving , for applying the parameters and settings from catchment area elements in the same database (i.e. also from other variants and projects)
and for closing the window. It is important to know that the catchment area window also saves automatically when closing.
Properties
In the Properties tab, general parameters and parameters of the catchment area for topography, surface runoff retention and measures in the catchment area are entered, and the calculation method for determining the runoff-effective fraction of precipitation is selected and the required parameters are entered.
Topography
right The data to be entered in the Topography section is normally determined from a GIS. The area of the catchment area is decisive for the amount of runoff that is generated in this catchment area, because the precipitation as precipitation height is included in the NA calculation and is therefore still scaled with the area. The degree of sealing determines the proportion of sealed area in the total area and describes the proportion that runs off as urban surface runoff. The urban surface runoff is separated from the remaining natural surface runoff calculated and retained in a separate storage cascade. The discharge allocation can also be used to assign it to a different discharge element. The input for longest flow distance and maximum and minimum height are used for the automatic calculation of the retention constants of surface runoff.
Retention-Surface Runoff
right The parameters for the discharge concentration of the surface discharge are entered in the Retention- Surface Discharge section. Using the button calculate, they can be automatically calculated from the input for topography. Attention: if the checkbox calculate automatically is set, the automatically calculated parameters are always used for the simulation, based on the current input in the topography section. If the retection constants of the surface runoff shall be changed and calibrated, the check mark must be removed first.
Measures in the catchment area
right In the Measures in the Catchment Area section, the user can enter the trough loss . Using the button Irrigation he can also define and connect a irrigation scheme.
Calculation
For the calculation of Infiltration or the runoff-effective precipitation, Talsim-NG offers three calculation options, which can be selected in the Calculation Method section.
Runoff curve number
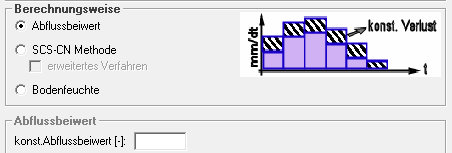
If the discharge coefficient method is selected, a constant discharge coefficient between 0 and 1 can be entered. This determines the amount of precipitation that is discharged after deducting losses.
SCS-CN Method
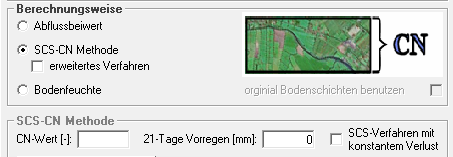
If the SCS-CN method has been selected as the calculation method, the CN value and the 21-day rainfall index can be entered in the lower area. In addition, a check box can be used to activate whether the SCS method is calculated with constant loss.
Extended procedure
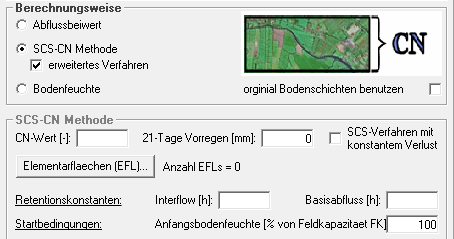
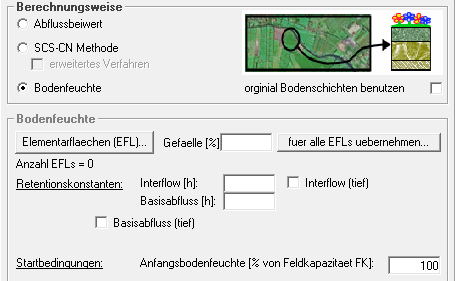
In the extended procedure, not only the superficial direct runoff is determined, but also a soil moisture simulation is carried out for the infiltrated part and the components interflow and basic runoff are determined. For this purpose, the elementary areas must be created using the corresponding button. For interflow and base discharge the retention constants for the calculation of the discharge concentration are also defined. The initial soil moisture can also be entered (default setting: 100%). If the checkbox Use original soil layers is activated, the soil layers are used as entered by the user. By default, the soil layers are grouped into three internal calculation layers (infiltration layer, rooting layer and transport layer).
Soil Moisture
The calculation option soil moisture simulation is the calculation option that requires the input of most parameters. The catchment area is divided into individual elementary areas (hydrologic response units) using the elementary areas (EFL) button. The catchment area window provides the option to assign a uniform slope to all elementary surfaces.
For interflow and base discharge the retention constants for the calculation of discharge concentration are defined.
If the calculation of the deep interflow and/or the deep base discharge is also activated via checkboxes, the retention constants must also be entered for these two discharge components, as well as the desired division ratio for the base discharge into base discharge and deep base discharge. The initial soil moisture can also be entered (default setting: 100%).
If the checkbox Use original soil layers in the calculation area is activated, the soil layers will be used as entered by the user. By default, the soil layers are grouped into three internal calculation layers (infiltration layer, rooting layer and transport layer).
Simulation Settings
rightThe Simulation Settings tab is used to define the loads on the catchment area and to select the calculation type for the snow calculation.
The selection of the time series is done with the button Selection ![]() . The button Display
. The button Display ![]() opens a window with the time series graphics.
opens a window with the time series graphics.
constant hydrograph can be connected via their respective selection menus and can be deleted with the DELETE-key. By clicking the button Show chart ![]() , the hydrograph window opens, where the chart can be edited directly. It is important to note that the hydrograph can also be connected at other places in the model and that the changes are valid everywhere. If you want to modify a chart only for the current catchment area, a copy has to be created and connected before.
, the hydrograph window opens, where the chart can be edited directly. It is important to note that the hydrograph can also be connected at other places in the model and that the changes are valid everywhere. If you want to modify a chart only for the current catchment area, a copy has to be created and connected before.
Niederschlag
Niederschlag kann direkt als Zeitreihe angeschlossen werden und ggf. noch mit einem Faktor skaliert werden. Falls keine Langzeitsimulation sondern eine Kurzfristprognose mit Modellregen gerechnet werden soll, werden die Einstellungen direkt über die Kurzfristprognose gesteuert.
Temperatur
Die Temperatur kann entweder als Zeitreihe oder als mittlere Temperatur, ggfs. skaliert mit einem Jahres- und/oder Tagesgang eingegeben werden.
Verdunstung
Für die Verdunstung gibt es die Möglichkeit eine Zeitreihe anzuschließen, eine Jahresverdunstung zu definieren oder die Werte aus einer vorher angelegten Verdunstungsberechnung zu verwenden.
Basisabfluss: Mittelwert
Ein Basisabfluss kann als mittlere Spende angegeben und ggfs. noch mit einem Jahresgang skaliert werden.
Bei Bodenfeuchteberechnung bestimmt dieser Wert den Startinhalt (rückgerechnet) für den Basisabflussspeicher. Aus den hier angegebenen l/s km² wird ein Volumen rückgerechnet, welches zusammen mit der Retentionskonstante des Basisabflusses diesen Wert für den Basisabfluss zu Beginn der Simulation ergibt.
Schnee
Ablaufzuordnung
rightHat das Einzugegebietselement mehr als ein Ablaufelement, können in dem Reiter Ablaufzuordnung die unterschiedlichen Abflusskomponenten an verschiedene Ablaufelemente verschickt werden. Standardmäßig geht der gesamte Abfluss an den ersten Ablauf. Per Drag&Drop können die links im Bild dargestellten Abflusskomponenten auf die Abläufe rechts im Bild gezogen werden, um die Verbindung herzustellen oder wieder zu löschen. Durch Klicken auf die Abflusskomponenten wird die jeweilige Verbindung zum Ablauf rot markiert. Werden die Abläufe geklickt, werden die Verbindungen von sämtlichen zufließenden Abflusskomponenten markiert.
