Zeitreihenverwaltung/en: Unterschied zwischen den Versionen
Ferrao (Diskussion | Beiträge) (Die Seite wurde neu angelegt: „You can use the following buttons.“) |
Ferrao (Diskussion | Beiträge) (Die Seite wurde neu angelegt: „{| class="wikitable" |- |'''Insert Row'' ||A row is inserted above the selected cell. |- |'''Add line'' || At the end of the time series a line is added. |-…“) |
||
| Zeile 226: | Zeile 226: | ||
{| class="wikitable" | {| class="wikitable" | ||
|- | |- | ||
|''' | |'''Insert Row'' ||A row is inserted above the selected cell. | ||
|- | |- | ||
|''' | |'''Add line'' || At the end of the time series a line is added. | ||
|- | |- | ||
|''' | |'''Delete line'' ||The selected line is deleted. | ||
|- | |- | ||
|''' | |'''Graphic'' ||The time series is displayed graphically. | ||
|- | |- | ||
|''' | |'''Check date'' ||The date of the time series is checked. This means that the date must be ascending in time. | ||
|- | |||
|'''Write values'' ||The time series is stored with the entered values on the server and in the database. A binary file is also created in the system data with the same ID number. | |||
|- | |||
|''Delete values'' ||All values are deleted. | |||
|- | |- | ||
|} | |} | ||
Version vom 28. Oktober 2020, 11:04 Uhr
before=Menubar System Administration
Time series can be storage and type related in a separate database. All time series are organized in TALSIM-NG in a separate time series management. The time series can be displayed graphically and edited in tabular form. There is also an integrated basic statistics function in TALSIM-NG. This gives average values, etc. for a defined time period.
Open time series administration
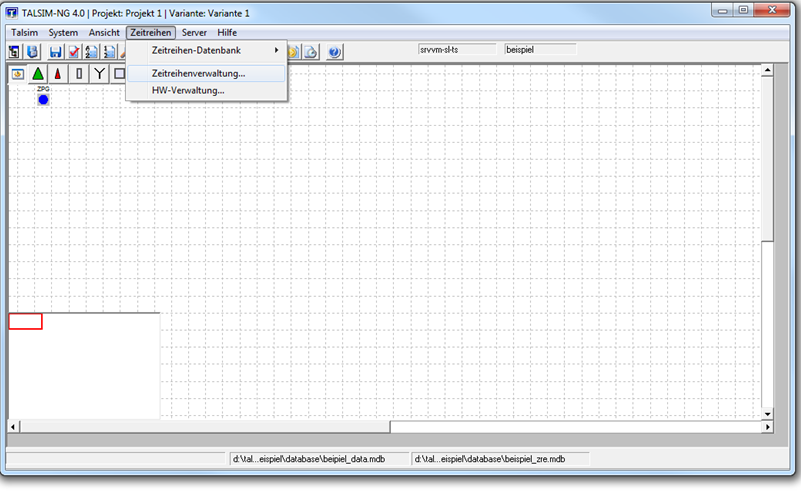
You can open the time series administration via Menu bar -> Time series -> Time series administration. A window Talsim-User Selection... appears for user selection. If you want to create and edit time series, you have to login with your user name (here example, sample user) and confirm with OK. If you log in using another user, you can only see the stations and time series, but you cannot edit or delete them.
If you are logged in with your user name and have not created any time series yet, an empty TalsminNG - TS Explorer opens. This explorer can be customized with View, Folder and the Folder icon.
Create new station
Time series are basically assigned to stations, e.g. measuring stations. For this reason a station is created first. To do this, right click on the Explorer -> New Station. A window will open where you can enter the name of the station and confirm with OK.
In the following, the station is created with 15 subfolders. These subfolders reflect the type of hydrological, hydrometeorological, reservoir-dependent and geological size.
You can use the following buttons if you click on the new station in the Explorer on the right.
| New Station | A new empty station with 15 subfolders is created. |
| Edit Station | The dialog window Edit of a Talsim time series station is opened, in which information about the selected station can be edited. |
| Delete Station | The marked station is deleted with all associated time series. This operation cannot be undone. |
| Copy to Clipboard | |
| New Time Series | A new time series is created in the selected station. |
| Release Edit-lock | Share for editing the station by another editor. |
Create new time series
To create time series, right click on the Station -> New Time Series in the time series administration. A new Talsim object will be created and its name will be asked for. Confirm the time series name with OK.
In the Explorer, the following attributes are displayed for each time series:
| Name | Name of the time series. |
| ID | Identification number of a time series. ID corresponds to the ID of the stored binary file in the system data. Caution: Do not interchange with the ID of a simulation in the model and on the server. |
| Type | Hydrological, hydrometeorological, reservoir-dependent or geological quantity. With this setting the time series is assigned to one of the 15 subfolders of the station. Default value: discharge. |
| Unit | Unit of size. Default value: m³/s. |
| Interpretation | Information about the time series values, i.e. how to understand the timestamp and the value stored on it. Caution: wrongly set interpretations lead inevitably to incorrect results. For example, precipitation [mm] is usually a sum per time step. Default value: Current_value (linear_interpolation) |
| Origin | Origin of the time series. Default value: measured. |
| from | Date and time of the start of the time series. Default value: Day and time of creation. |
| to | Date and time of the end of the time series. Default value: Day and time of creation. |
| Data points | Number of data points. Default value: 0 |
The time series is created with the entered name and the consecutive ID number. The other attributes are first assigned default values.
You can use the following buttons if you click on the time series on the right side of the Explorer.
| Edit Time Series | The selected time series can be edited. |
| Chart | The time series can be displayed as a graph over time or as a continuous line. |
| Edit Value | Values with date are added to the selected time series. These can also be edited or deleted. |
| Statistics | Gives a short statistical overview of the time series. |
| Import Time Series | An already existing time series can be imported. |
| Export Time Series | The selected time series can be exported. |
| Delete Time Series | The selected time series is deleted. This operation cannot be undone. |
| Release Edit-lock | Release for editing the time series by another editor. |
| Refresh Attributes | After adjusting the attributes of a time series, the attributes are updated in the Explorer. |
Zeitreihe editieren
To adjust the attribute settings, right click on the Time Series -> Edit Time Series in the time series management.
The following dialog window opens for editing. The attributes for identification and settings, which are displayed in black, can be adjusted with a double click. With OK all time series settings are saved.
| Identification | Description | Description of the time series |
| Name | Name of the time series | |
| Settings | Altitude masl | Height of the measuring station |
| Coordinate-X | X-coordinate of the measuring station | |
| Coordinate-Y | Y-coordinate of the measuring station | |
| Interpretation | Information about the time series values i.e. how to understand the timestamp and the value stored on it. Caution: wrongly set interpretations lead inevitably to incorrect results.
Choose between: mini
| |
| Memo | Description of the origin of the time series and other additional information | |
| Origin | Origin of the time series
Choose between:
| |
| Type | Hydrological, hydrometeorological, reservoir-dependent or geological quantity. With this setting the time series is assigned to one of the 15 subfolders of the station.
Selection between
| |
| Unit | Unit of size.
Selection between ?,empty, number, class, mm/m, percent, h/d, 0/00, ml/l, mm, m, cm, km, hm, dm, l/ha, l/km², l/m², mNN, m², km², ha, cm², mm², dm², m³/m, m³, Tsd. m³, Mio. m³, l, hl, km³, cm³, mm³, m/s, mm/d, mm/h, mm/min, l/s/km², m/h, m/d, l/s/ha, m/s², m³/s, l/s, m³/d, m³/h, l/h, l/d, oC, kg, g, mg, t, s, min, h, d, w, mon, a, Datum, A, bar, pa, hpa, Grad, Rad, kg/m³, mg/l, g/l, l/kg, ml/g, Grad_C, kg/s, y/n |
Time series values
After a new time series is created and edited, values are added to it. To do this, right click on the Time Series -> Edit Value. If a time series with values already exists, they can be edited or deleted.
You can use the following buttons.
| Edit' | The values in the marked time series can be edited. |
| Add' | Values are added to the selected time series. |
| 'Delete | The values of the marked time series are deleted. This operation cannot be undone. |
Add values to time series
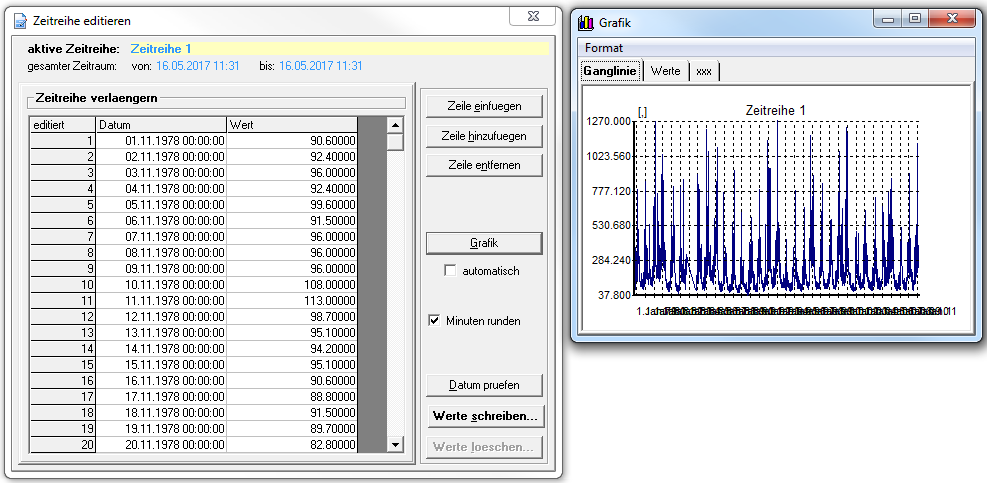
When adding the values to the time series, click on Add. The following window opens. This indicates that the time series does not yet contain any values and is therefore not yet stored on the server and database. With OK the window for editing the time series values opens.
You can use the following buttons.
| 'Insert Row | A row is inserted above the selected cell. |
| 'Add line | At the end of the time series a line is added. |
| 'Delete line | The selected line is deleted. |
| 'Graphic | The time series is displayed graphically. |
| 'Check date | The date of the time series is checked. This means that the date must be ascending in time. |
| 'Write values | The time series is stored with the entered values on the server and in the database. A binary file is also created in the system data with the same ID number. |
| Delete values | All values are deleted. |
Im Fenster wird die aktive Zeitreihe dargestellt und das Datum, welches zunächst noch dem Erstelldatum entspricht. Hier können Sie nun manuell das Datum mit dem entsprechenden Wert eingeben. Sie können auch eine Zeitreihe z.B. aus Excel mit Datum und Werten kopieren und in die erste Zelle klicken und einfügen (Tastenkombination: Strg+V).
Sind die Werte eingefügt, kann über Grafik die Zeitreihe dargestellt werden.
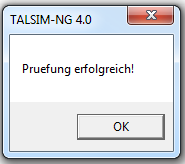
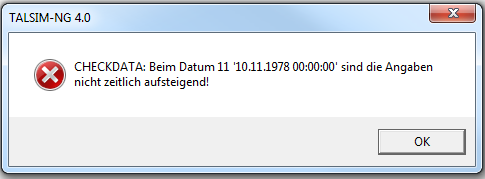
Im nächsten Schritt wird das Datum geprüft. Sind die Datumsangaben zeitlich korrekt aufsteigend, öffnet sich ein Fenster mit „Prüfung erfolgreich“. Andernfalls öffnet sich eine Fehlermeldung.
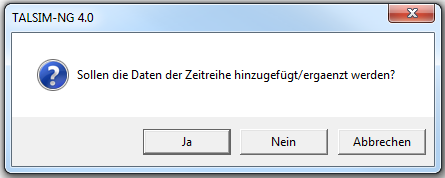
Sind alle Werte vollständig und das Datum geprüft, werden die Werte geschrieben. Im sich öffnenden Fenster klicken Sie zum bestätigen auf Ja, zum widerrufen auf Nein oder Abbrechen.
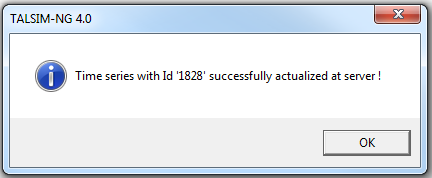
Mit einem Bestätigungsfenster wurde das Implementieren der Werte in die Zeitreihe als erfolgreich abgeschlossen. Das Editierfenster kann geschlossen werden. Erst mit diesem Schritt wird die Zeitreihe in der Zeitreihendatenbank und als Binärdatei in den Systemdaten gespeichert, sowie auf den Server exportiert.
Werte in der Zeitreihe bearbeiten
Zeitreihen können Sie bearbeiten, indem Sie mit Rechts auf die Zeitreihe -> Edit Values -> Edit klicken. Die aktive Zeitreihe mit passendem Datum wird angezeigt. Nun können Sie den Zeitraum auswählen für den Sie Änderungen durchführen möchten und im Anschluss in das Editierfenster laden. Die Daten werden entsprechend angezeigt. Mit den weiteren Schaltflächen können Sie die Zeitreihe bearbeiten wie unter Werte zur Zeitreihe hinzufügen bereits beschrieben.
Werte in der Zeitreihe löschen
Zeitreihe grafisch darstellen
Grafisch wird eine Zeitreihe mit Rechtsklick auf Zeitreihe -> Charts dargestellt. Sie haben die Wahl zwischen einer Ganglinie (Time series chart) und einer Dauerlinie (Duration curve).
Zeitreihe statistisch auswerten
Unter Rechtsklick Zeitreihe -> Statistic öffnet sich ein Statistik-Tool mit dem Sie die statistischen Momente für einen gewählten Zeitraum berechnen können. Weiterhin können Sie eine Niedrig- und Hochwasseranalyse durchführen. Die Ergebnisse werden Ihnen angezeigt, wenn Sie nach der Eingabe der Daten auf Berechnen klicken.
