Einzeleinleiterfenster/en: Unterschied zwischen den Versionen
Ferrao (Diskussion | Beiträge) (Die Seite wurde neu angelegt: „In the next deeper area the calculation method can be selected for the selected element. There is the possibility to choose between a constant discharge, if ne…“) |
Ferrao (Diskussion | Beiträge) Keine Bearbeitungszusammenfassung |
||
| (48 dazwischenliegende Versionen von 4 Benutzern werden nicht angezeigt) | |||
| Zeile 3: | Zeile 3: | ||
{{Navigation|vorher=Einzugsgebietsfenster|hoch=Fenster der Systemelemente|nachher=Transportstreckenfenster}} | {{Navigation|vorher=Einzugsgebietsfenster|hoch=Fenster der Systemelemente|nachher=Transportstreckenfenster}} | ||
<youtube alignment="center">https://youtu.be/cgMni2erdXc</youtube> | |||
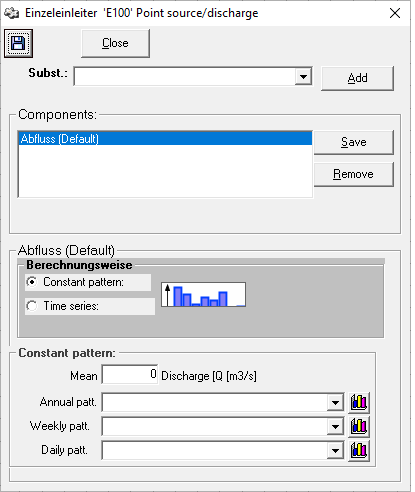
The properties for point sources can be opened by double-clicking on the element symbol in the flow network map [[Datei:Systemelement002.png|30px]] or by right-clicking → ''Properties''. | |||
At the top of the window there are two buttons, one for saving [[Datei:Button_speichern.PNG|Datei:Button_speichern.PNG]] and one for closing the window. It is important to know that the point source window does not save automatically when closed and also pressing the save button [[Datei:Button_speichern.PNG|Datei:Button_speichern.PNG]] is not sufficient. If parameters are changed, they must be written to the database with the ''Apply''-button. | |||
[[Datei:Einzeleinleiterfenster_leer_EN.PNG|Datei:Einzeleinleiterfenster_leer_EN.PNG]] | |||
==Type of Load== | |||
[[ | The default setting is that a point source brings a [[Special:MyLanguage/Belastungsdefinition/ Modellinput|load]] in the form of an outflow into the system. If additional [[Special:MyLanguage/Stoffparameterfenster|substances are created]], these can also be assigned to point sources. To do this, select the desired substance from the selection list and click the button ''Add''. | ||
[[Datei:Einzeleinleiter_Stoffe_zuordnen_EN.png|Datei:Einzeleinleiter_Stoffe_zuordnen_EN.png]] | |||
[[Datei: | All elements assigned to the point source appear in the area ''Components''. With the ''Remove''-button additionally assigned substances can be removed again. When pressing the buttons ''Add'' and ''Remove'', the changes to elements are written directly into the database. The element, for which the settings shall be set in the lower part of the point source window, is selected by clicking on it. It is then marked with a blue bar. It is important to click the ''Save'' button after making changes to the element parameters. Otherwise the changes will be lost when the point source window is closed. Clicking the button with the [[Datei:Button_speichern.PNG|Datei:Button_speichern.PNG]] save icon is not sufficient! | ||
[[Datei:Einzeleinleiter_zugeordnete_Elemente_EN.png|Datei:Einzeleinleiter_zugeordnete_Elemente_EN.png]] | |||
==Calculation Options== | |||
In the following step the calculation method can be chosen for the previously selected element. There is the possibility to choose between a constant discharge, if necessary scaled with a constant pattern (annual, weekly and daily) and between a discharge hydrograph in form of a time series. | |||
[[Datei:Einzeleinleiter_Berechnungsweise_EN.png|Datei:Einzeleinleiter_Berechnungsweise_EN.png]] | |||
[[ | If the selected element is a substance, you can also select whether the entry is made as a load [kg/s] or as a concentration [mg/l]. It is important to know that a substance is only entered into the system if the discharge is > 0 m³/s. If you want to enter a load without an outflow, a minimum outflow must still be set. | ||
[[Datei:Einzeleinleiter_Berechnungsweise_Stoff_EN.png|Datei:Einzeleinleiter_Berechnungsweise_Stoff_EN.png]] | |||
===Constant Graph=== | |||
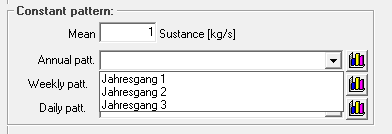
[[ | If the calculation option ''Constant pattern'' is selected, a constant discharge/load can be entered and already created [[Special:MyLanguage/Ganglinienfenster|annual, weekly and daily patterns]] can be selected from the selection menus. The selection can be deleted by pressing the DELETE key. By clicking the button ''Show Hydrograph'' [[File:Button_Ganglinie_ anzeigen.png|File:Button_Ganglinie_ anzeigen.png]], the window of the hydrograph opens where it can be edited directly. It is important to note, that the chart can be connected to other places in the model and that the changes are valid everywhere. If you want to change a graph only for the current single line, a copy has to be created and connected before. | ||
[[Datei:Einzeleinleiter_Jahresgang_EN.png|Datei:Einzeleinleiter_Jahresgang_EN.png]] | |||
===Time Series=== | |||
[[Datei: | If the calculation option ''Time Series'' is selected, a time series created in [[Special:MyLanguage/Zeitreihenverwaltung|time series management]] an be linked and, if necessary, scaled by a factor. The time series is selected via the button ''Selection'' [[Datei:Button_Zeitreihe_zuordnen.png|Datei:Button_Zeitreihe_zuordnen.png]]. The button ''Display'' [[Datei:Button_Zeitreihe_anzeigen.png|Datei:Button_Zeitreihe_anzeigen.png]] opens a window with a [[Special:MyLanguage/Grafikfenster|time series graphics]]. | ||
[[Datei:Einzeleinleiterfenster_Zeitreihe_EN.PNG|Datei:Einzeleinleiterfenster_Zeitreihe_EN.PNG]] | |||
Aktuelle Version vom 25. Februar 2021, 12:28 Uhr
The properties for point sources can be opened by double-clicking on the element symbol in the flow network map ![]() or by right-clicking → Properties.
At the top of the window there are two buttons, one for saving
or by right-clicking → Properties.
At the top of the window there are two buttons, one for saving and one for closing the window. It is important to know that the point source window does not save automatically when closed and also pressing the save button
is not sufficient. If parameters are changed, they must be written to the database with the Apply-button.
Type of Load
The default setting is that a point source brings a load in the form of an outflow into the system. If additional substances are created, these can also be assigned to point sources. To do this, select the desired substance from the selection list and click the button Add.
All elements assigned to the point source appear in the area Components. With the Remove-button additionally assigned substances can be removed again. When pressing the buttons Add and Remove, the changes to elements are written directly into the database. The element, for which the settings shall be set in the lower part of the point source window, is selected by clicking on it. It is then marked with a blue bar. It is important to click the Save button after making changes to the element parameters. Otherwise the changes will be lost when the point source window is closed. Clicking the button with the save icon is not sufficient!
Calculation Options
In the following step the calculation method can be chosen for the previously selected element. There is the possibility to choose between a constant discharge, if necessary scaled with a constant pattern (annual, weekly and daily) and between a discharge hydrograph in form of a time series.
If the selected element is a substance, you can also select whether the entry is made as a load [kg/s] or as a concentration [mg/l]. It is important to know that a substance is only entered into the system if the discharge is > 0 m³/s. If you want to enter a load without an outflow, a minimum outflow must still be set.
Constant Graph
If the calculation option Constant pattern is selected, a constant discharge/load can be entered and already created annual, weekly and daily patterns can be selected from the selection menus. The selection can be deleted by pressing the DELETE key. By clicking the button Show Hydrograph ![]() , the window of the hydrograph opens where it can be edited directly. It is important to note, that the chart can be connected to other places in the model and that the changes are valid everywhere. If you want to change a graph only for the current single line, a copy has to be created and connected before.
, the window of the hydrograph opens where it can be edited directly. It is important to note, that the chart can be connected to other places in the model and that the changes are valid everywhere. If you want to change a graph only for the current single line, a copy has to be created and connected before.
Time Series
If the calculation option Time Series is selected, a time series created in time series management an be linked and, if necessary, scaled by a factor. The time series is selected via the button Selection ![]() . The button Display
. The button Display ![]() opens a window with a time series graphics.
opens a window with a time series graphics.


