Zeitreihenverwaltung/en: Unterschied zwischen den Versionen
Ferrao (Diskussion | Beiträge) (Die Seite wurde neu angelegt: „In the Explorer, the following attributes are displayed for each time series:“) |
Keine Bearbeitungszusammenfassung |
||
| (172 dazwischenliegende Versionen von 5 Benutzern werden nicht angezeigt) | |||
| Zeile 1: | Zeile 1: | ||
<languages/> | <languages/> | ||
{{Navigation|vorher=Menüleiste Systemverwaltung|hoch=Hauptseite|nachher=Einzelfenster von Modellkomponenten}} | |||
Time series can be | Time series can be stored in TALSIM-NG's own time series manager, where they are classified by the type of data and the station they belong to. There they can be viewed graphically and edited tabularly. A basic statistics' tool, which can calculate average values for a defined period of time as well as other statistics, is also integrated in the time series manager. | ||
=== | === Opening the Time Series Manager=== | ||
The time series manager can be accessed via the ''Menu bar → Time series → Time series manager''. The '''Talsim-User Selection''' window, where you are required to choose a user to proceed, appears. If you want to create and edit time series, you should choose your username and confirm with '''OK'''. If you log in using another username, you can only see the stations and time series, but you cannot edit or delete them. | |||
[[Datei: | [[Datei:Zeitreihe001_EN.png|Datei:Zeitreihe001EN_.png|500px]] | ||
[[Datei:Zeitreihe002_EN.png]] | |||
If you are logged in with your | If you are logged in with your username and have not created any time series yet, an empty '''TalsminNG - TS Explorer''' opens. This explorer can be customized using '''View''', '''Folder''', as well as the '''folder icon'''. | ||
[[ | [[Datei:Zeitreihe003_EN.png]] | ||
===Create | ===Create New Station=== | ||
Time series are | Time series are principally assigned to stations, e.g. measuring stations. For this reason a station should be created first. To do this, right-click on the ''Explorer → New Station''. A window, where you can enter the name of the station and confirm with '''OK''', will appear. | ||
[[ | [[Datei:Zeitreihe004_EN.png]] [[Datei:Zeitreihe005_EN.png|Datei:Zeitreihe005_EN.png]] | ||
Subsequently, a new station, as well as 15 subfolders are created. These subfolders present the different types of the hydrological, hydrometeorological, or storage-dependent variables that can be saved as time series in the TS Explorer. | |||
[[ | [[Datei:Zeitreihe006_EN.png]] | ||
You have a choice of the following options when you right-click on the new station in the explorer. | |||
{| class="wikitable" style="width:70%" | {| class="wikitable" style="width:70%" | ||
| Zeile 36: | Zeile 37: | ||
|'''New Station''' ||A new empty station with 15 subfolders is created. | |'''New Station''' ||A new empty station with 15 subfolders is created. | ||
|- | |- | ||
|'''Edit Station''' ||The dialog window ''Edit of a Talsim time series station'' | |'''Edit Station''' ||The dialog window ''Edit of a Talsim time series station'', in which information about the selected station can be edited, is opened. | ||
|- | |- | ||
|'''Delete Station''' ||The marked station | |'''Delete Station''' ||The marked station and all associated time series are deleted. This operation cannot be undone. | ||
|- | |- | ||
|'''Copy to Clipboard''' || | |'''Copy to Clipboard''' || The list of time series associated with the station as well as their metadata is copied to the clipboard. | ||
|- | |- | ||
|'''New Time Series''' ||A new time series | |'''New Time Series''' ||A new time series associated with the selected station is created. | ||
|- | |- | ||
|'''Release Edit-lock''' || | |'''Release Edit-lock''' ||Releases the edit-lock of the station, so it can be edited by another user. | ||
|- | |- | ||
|} | |} | ||
=== Create | === Create New Time Series=== | ||
To create time series, right click on the ''Station | To create a time series, right-click on the ''Station → New Time Series'' in the [[Special:MyLanguage/Belastungsdefinition / Modellinput#Zeitreihenverwaltung|time series explorer]]. A window will open, prompting you to enter the name of the new time series. Confirm with '''OK'''. | ||
[[Datei: | [[Datei:Zeitreihe007_EN.png|Datei:Zeitreihe007_EN.png]] | ||
The following attributes are displayed for each time series in the explorer: | |||
{| class="wikitable" style="width:70%" | {| class="wikitable" style="width:70%" | ||
|- | |- | ||
|'''Name''' || | |'''Name''' ||Name of the time series. | ||
|- | |- | ||
|'''ID''' || | |'''ID''' ||Identification number of a time series. ID corresponds to the ID of the binary file, stored in the system data. Caution: Not to be confused with the ID of a simulation in the model and on the server. | ||
|- | |- | ||
|''' | |'''Type''' ||Hydrological, hydrometeorological, storage-dependent or geological variable. With this setting the time series is assigned to one of the 15 subfolders of the station. Default value: discharge. | ||
|- | |- | ||
|'''Unit''' || | |'''Unit''' ||Unit of the values. Default value: m³/s. | ||
|- | |- | ||
|'''Interpretation''' ||Information | |'''Interpretation''' ||Information about the time series values, i.e. how to understand the timestamp and the value stored in it. Caution: wrongly set interpretations inevitably lead to incorrect results. For example, precipitation [mm] is usually a sum per timestep. Default value: Current_value (linear_interpolation) | ||
|- | |- | ||
|'''Origin''' || | |'''Origin''' ||Origin of the time series. Default value: measured. | ||
|- | |- | ||
|'''from''' || | |'''from''' ||Date and time of the start of the time series. Default value: Day and time of creation. | ||
|- | |- | ||
|'''to''' || | |'''to''' ||Date and time of the end of the time series. Default value: Day and time of creation. | ||
|- | |- | ||
|'''Data points''' || | |'''Data points''' ||Number of data points. Default value: 0 | ||
|- | |- | ||
|} | |} | ||
[[ | [[Datei:Zeitreihe008_EN.png]] | ||
The created time series is assigned the chosen name and a consecutive ID number. The other attributes are filled with the default values. | |||
You can use the following buttons if you right-click on the time series in the explorer. | |||
{| class="wikitable" style="width:70%" | {| class="wikitable" style="width:70%" | ||
|- | |- | ||
|'''Edit Time Series''' || | |'''Edit Time Series''' ||The selected time series can be edited. | ||
|- | |- | ||
|'''Chart''' || | |'''Chart''' ||The time series can be displayed as a graph over time or as a duration curve. | ||
|- | |- | ||
|'''Edit | |'''Edit Values''' ||Values with date are added to the selected time series. Values can also be edited or deleted. | ||
|- | |- | ||
|'''Statistics''' || | |'''Statistics''' ||Calculates a statistical overview of the time series. | ||
|- | |- | ||
|'''Import Time Series''' || | |'''Import Time Series''' ||An existing time series can be imported. | ||
|- | |- | ||
|'''Export Time Series''' || | |'''Export Time Series''' ||The selected time series can be exported. | ||
|- | |- | ||
|'''Delete Time Series''' || | |'''Delete Time Series''' ||The selected time series is deleted. This operation cannot be undone. | ||
|- | |- | ||
|'''Release Edit-lock''' || | |'''Release Edit-lock''' ||Releases the edit-lock of the time series, so it can be edited by another user.. | ||
|- | |- | ||
|'''Refresh Attributes''' || | |'''Refresh Attributes''' ||After adjusting the attributes of a time series, those attributes are updated in the explorer. | ||
|- | |- | ||
|} | |} | ||
Edit Time Series | |||
To adjust the attributes of a time series, right-click on ''Time Series → Edit Time Series'' in the time series manager. | |||
[[ | [[Datei:Zeitreihe009_EN.png]] | ||
The following dialog window, where you can edit the attributes, opens. The attributes assigned to identification and settings, which are displayed in black, can be adjusted with a double-click. By clicking OK all time series attributes can be saved. | |||
[[ | [[Datei:Zeitreihe010_EN.png]] | ||
{| class="wikitable" style="width:70%" | {| class="wikitable" style="width:70%" | ||
|- | |- | ||
|rowspan="2" style="text-align:center" |''' | |rowspan="2" style="text-align:center" |'''Identification''' | ||
|''Description'' | |''Description'' | ||
| | |Description of the time series | ||
|- | |- | ||
|''Name'' | |''Name'' | ||
|Name | |Name of the time series | ||
|- | |- | ||
|rowspan="8" style="text-align:center"|'''Settings''' | |rowspan="8" style="text-align:center"|'''Settings''' | ||
|''Altitude masl'' | |''Altitude masl'' | ||
| | |Height of the measuring station in meters above sea level | ||
|- | |- | ||
|''Coordinate-X'' | |''Coordinate-X'' | ||
|X- | |X-coordinate of the measuring station | ||
|- | |- | ||
|''Coordinate-Y'' | |''Coordinate-Y'' | ||
|Y- | |Y-coordinate of the measuring station | ||
|- | |- | ||
|''Interpretation'' | |''Interpretation'' | ||
|Information | |Information about the time series values, i.e. how to understand the timestamp and the value stored in it. Caution: wrongly defined interpretations inevitably lead to incorrect results. | ||
Choice of: [[Datei:00036_EN.png|mini]] | |||
* | *BlockLeft | ||
* | *BlockRight | ||
* | *Instantaneous_(Linear_Interpolation) | ||
* | *Cumulative | ||
* | *CumulativePerTimeStep | ||
* | *Undefined | ||
|- | |- | ||
|''Memo'' | |''Memo'' | ||
| | |Description of the origin of the time series and other additional information | ||
|- | |- | ||
|''Origin'' | |''Origin'' | ||
| | |Origin of the time series | ||
Choice of: | |||
* | *derived | ||
* | *measured | ||
* | *imported | ||
* | *manual | ||
* | *simulated | ||
* | *miscellaneous | ||
* | *synthetic | ||
|- | |- | ||
|''Type'' | |''Type'' | ||
| | |Hydrological, hydrometeorological, storage-dependent or geological variable | ||
With this setting the time series is assigned to one of the 15 subfolders of the station. | |||
* | Choice of: | ||
* | *area | ||
* | *discharge | ||
* | *evaporation | ||
* | *humidity | ||
* | *mass movement | ||
* | *precipitation | ||
* | *pressure | ||
* | *soil process | ||
* | *storage | ||
* | *sunshine | ||
* | *temperature | ||
* | *unknown | ||
* | *velocity | ||
* | *water level | ||
*wind | |||
|- | |- | ||
|Unit | |Unit | ||
| | |Unit of the variable | ||
Choice of: | |||
?, | ?,empty, number, class, mm/m, percent, h/d, 0/00, ml/l, mm, m, cm, km, hm, dm, l/ha, l/km², l/m², mNN, m², km², ha, cm², mm², dm², m³/m, m³, Tsd. m³, Mio. m³, l, hl, | ||
km³, cm³, mm³, m/s, mm/d, mm/h, mm/min, l/s/km², m/h, m/d, l/s/ha, m/s², m³/s, l/s, m³/d, m³/h, l/h, l/d, | km³, cm³, mm³, m/s, mm/d, mm/h, mm/min, l/s/km², m/h, m/d, l/s/ha, m/s², m³/s, l/s, m³/d, m³/h, l/h, l/d, °C, kg, g, mg, t, s, min, h, d, w, mon, a, Datum, | ||
A, bar, pa, hpa, Grad, Rad, kg/m³, mg/l, g/l, l/kg, ml/g, Grad_C, kg/s, y/n | A, bar, pa, hpa, Grad, Rad, kg/m³, mg/l, g/l, l/kg, ml/g, Grad_C, kg/s, y/n | ||
|- | |- | ||
|} | |} | ||
===Time Series Values=== | |||
After a new time series is created and edited, values can be added to it. To do this, right-click on the ''Time Series → Edit Value''. If a time series with values already exists, the values can be edited or deleted. | |||
[[Datei:Zeitreihe0011_EN.png]] | |||
You can use the following buttons: | |||
{| class="wikitable" | {| class="wikitable" | ||
|- | |- | ||
|'''Edit''' || | |'''Edit''' ||Selected values of the time series can be edited. | ||
|- | |- | ||
|'''Add''' || | |'''Add''' ||Values can be added to the time series. | ||
|-. | |-. | ||
|'''Delete''' || | |'''Delete''' ||Selected values of the time series can be deleted. This operation cannot be undone. | ||
|- | |- | ||
|} | |} | ||
==== | ====Add Values to Time Series==== | ||
To add new values to the time series, click on '''add'''. The following ''TalsimNGZreProvider'' window opens. This indicates that the time series does not contain any values yet, and is, therefore, not stored on the server on in the database. By clicking '''OK''' the window for editing the time series values opens. | |||
[[Datei: | [[Datei:Zeitreihe012_EN.png|Datei:Zeitreihe012_EN.png]] [[Datei:Zeitreihe013_EN.png]] | ||
Here you can use the following buttons: | |||
{| class="wikitable" | {| class="wikitable" | ||
|- | |- | ||
|''' | |'''Insert Row''' ||A row is inserted above the selected cell. | ||
|- | |- | ||
|''' | |'''Add Row''' || A row is added to the end of the time series. | ||
|-. | |- | ||
|''' | |'''Remove Row''' ||The selected row is removed. | ||
|- | |||
|'''Graph''' ||The time series is displayed graphically. | |||
|- | |- | ||
|''' | |'''Check dates''' ||The date of the time series is checked. This means that the date must be ascending in time. | ||
|- | |- | ||
|''' | |'''Write values''' ||The time series and its values are stored on the server and in the database. Additionally, a binary file, named after the ID of the time series, is created in the system data. | ||
|- | |- | ||
|''' | |'''Delete values''' ||All values are deleted. | ||
|- | |- | ||
|} | |} | ||
The 'Edit time series' window shows the active time series, as well as the date, which by default corresponds to the date of creating the time series, unless it has been manually changed. Here you can manually enter a date and its corresponding value. You can also copy a time series with dates and values e.g. from Excel and click on the first cell of the table and paste it there (key combination: Ctrl+V). | |||
When the values are inserted, the time series can be displayed using '''Graph'''. | |||
[[Datei: | [[Datei:Zeitreihe014_EN.png|Datei:Zeitreihe014_EN.png]] | ||
In the next step the date is checked. If the dates are ascending, a window with "Check successful!" will appear. Otherwise an error message will be displayed. | |||
[[Datei: | [[Datei:Zeitreihe015_EN.png|Datei:Zeitreihe015_EN.png]] [[Datei:Zeitreihe016_EN.png|Datei:Zeitreihe016_EN.png]] | ||
If all values are complete and the date is successfully checked, the values are written. In the appearing window, click '''Yes''' to confirm, '''No''' or '''Cancel''' to cancel. | |||
[[Datei:Zeitreihe017_EN.png|Datei:Zeitreihe017_EN.png]] | |||
The implementation of the values into the time series has been successful if the following confirmation window appears. Completing this step, saves the time series in the time series database as well as in the system data as a binary file, and exports the time series to the server. The editing window can now be closed. | |||
[[ | [[Datei:Zeitreihe018_EN.png|Datei:Zeitreihe018_EN.png]] | ||
==== | ====Edit Values of the Time Series==== | ||
Time series can be edited by right-clicking on the ''Time Series → Edit Values → Edit''. The active time series and its appropriate date is displayed. Now you can select the time period for which you want to make changes to load it into the edit window. The data will be displayed accordingly. With the other buttons you can edit the time series as described under [[Special:MyLanguage/Belastungsdefinition / Modellinput#Werte zur Zeitreihe hinzufügen|''Add Values to Time Series'']]. | |||
[[Datei:Zeitreihe019_EN.png]] | |||
<div class="mw-translate-fuzzy"> | |||
====[[Special:MyLanguage/Werte in der Zeitreihe löschen|Delete Values of the Time Series]]==== | |||
</div> | |||
===Display Time Series Graphically=== | |||
A time series can be displayed graphically by right-clicking on ''Time Series → Charts''. You have the choice between a [[Special:MyLanguage/Ganglinie|hydrograph]] (Time series chart) and a [[Special:MyLanguage/Dauerlinie|duration curve]]. | |||
[[Datei:Zeitreihe020_EN.png]] [[Datei:Zeitreihe021_EN.png]] | |||
=== Evaluate Time Series Statistically=== | |||
Right-clicking ''Time Series → Statistics'' opens a statistics tool with which you can calculate severlal statistical measures for a predefined period. Furthermore, you can perform a low water or flood analysis. The results are displayed once you click on '''Calculate''' after entering the required data. | |||
[[Datei:Zeitreihe022_EN.png]] | |||
<div class="mw-translate-fuzzy"> | |||
===Import Time Series=== | |||
</div> | |||
=== | <div class="mw-translate-fuzzy"> | ||
=== Export Time Series=== | |||
</div> | |||
<div class="mw-translate-fuzzy"> | |||
===Delete Time Series=== | |||
</div> | |||
===Release Edit- | <div class="mw-translate-fuzzy"> | ||
===Release Edit-Lock=== | |||
</div> | |||
Aktuelle Version vom 30. August 2021, 11:43 Uhr
Time series can be stored in TALSIM-NG's own time series manager, where they are classified by the type of data and the station they belong to. There they can be viewed graphically and edited tabularly. A basic statistics' tool, which can calculate average values for a defined period of time as well as other statistics, is also integrated in the time series manager.
Opening the Time Series Manager
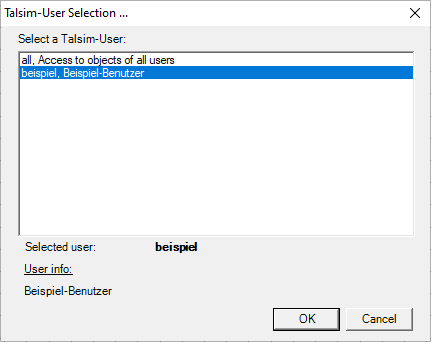
The time series manager can be accessed via the Menu bar → Time series → Time series manager. The Talsim-User Selection window, where you are required to choose a user to proceed, appears. If you want to create and edit time series, you should choose your username and confirm with OK. If you log in using another username, you can only see the stations and time series, but you cannot edit or delete them.
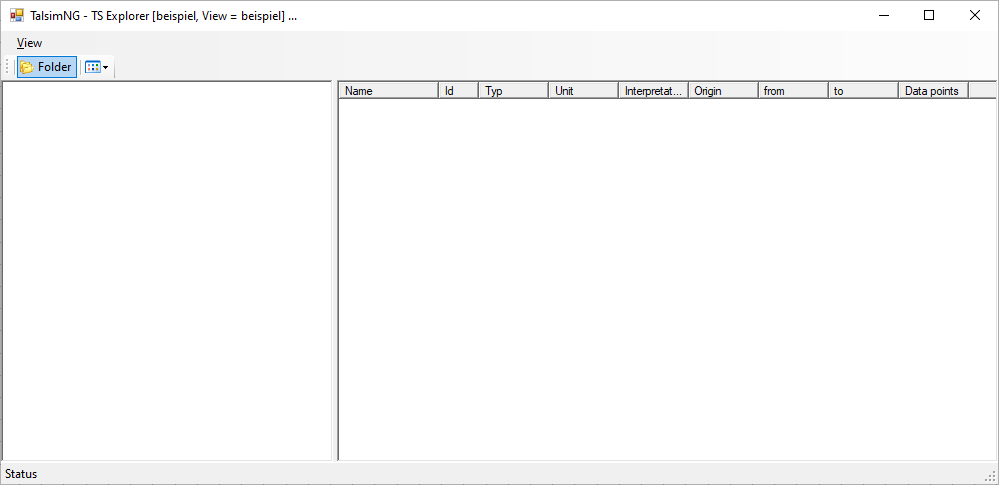
If you are logged in with your username and have not created any time series yet, an empty TalsminNG - TS Explorer opens. This explorer can be customized using View, Folder, as well as the folder icon.
Create New Station
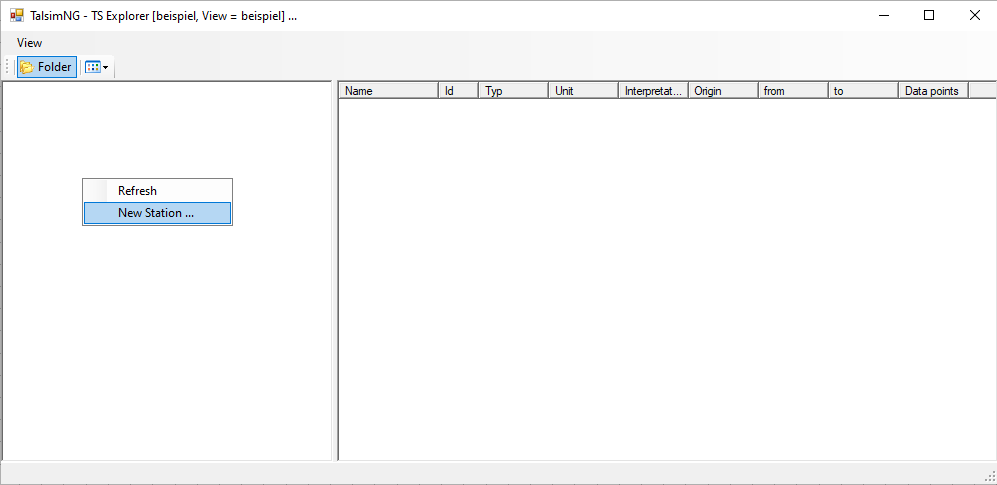
Time series are principally assigned to stations, e.g. measuring stations. For this reason a station should be created first. To do this, right-click on the Explorer → New Station. A window, where you can enter the name of the station and confirm with OK, will appear.
Subsequently, a new station, as well as 15 subfolders are created. These subfolders present the different types of the hydrological, hydrometeorological, or storage-dependent variables that can be saved as time series in the TS Explorer.
You have a choice of the following options when you right-click on the new station in the explorer.
| New Station | A new empty station with 15 subfolders is created. |
| Edit Station | The dialog window Edit of a Talsim time series station, in which information about the selected station can be edited, is opened. |
| Delete Station | The marked station and all associated time series are deleted. This operation cannot be undone. |
| Copy to Clipboard | The list of time series associated with the station as well as their metadata is copied to the clipboard. |
| New Time Series | A new time series associated with the selected station is created. |
| Release Edit-lock | Releases the edit-lock of the station, so it can be edited by another user. |
Create New Time Series
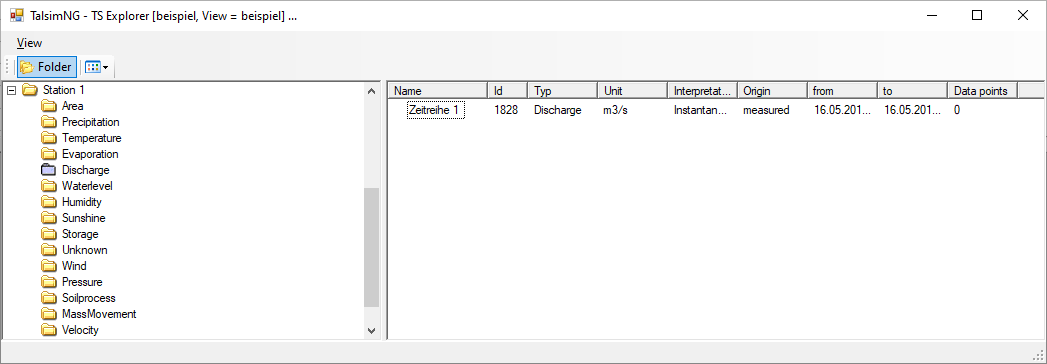
To create a time series, right-click on the Station → New Time Series in the time series explorer. A window will open, prompting you to enter the name of the new time series. Confirm with OK.
The following attributes are displayed for each time series in the explorer:
| Name | Name of the time series. |
| ID | Identification number of a time series. ID corresponds to the ID of the binary file, stored in the system data. Caution: Not to be confused with the ID of a simulation in the model and on the server. |
| Type | Hydrological, hydrometeorological, storage-dependent or geological variable. With this setting the time series is assigned to one of the 15 subfolders of the station. Default value: discharge. |
| Unit | Unit of the values. Default value: m³/s. |
| Interpretation | Information about the time series values, i.e. how to understand the timestamp and the value stored in it. Caution: wrongly set interpretations inevitably lead to incorrect results. For example, precipitation [mm] is usually a sum per timestep. Default value: Current_value (linear_interpolation) |
| Origin | Origin of the time series. Default value: measured. |
| from | Date and time of the start of the time series. Default value: Day and time of creation. |
| to | Date and time of the end of the time series. Default value: Day and time of creation. |
| Data points | Number of data points. Default value: 0 |
The created time series is assigned the chosen name and a consecutive ID number. The other attributes are filled with the default values.
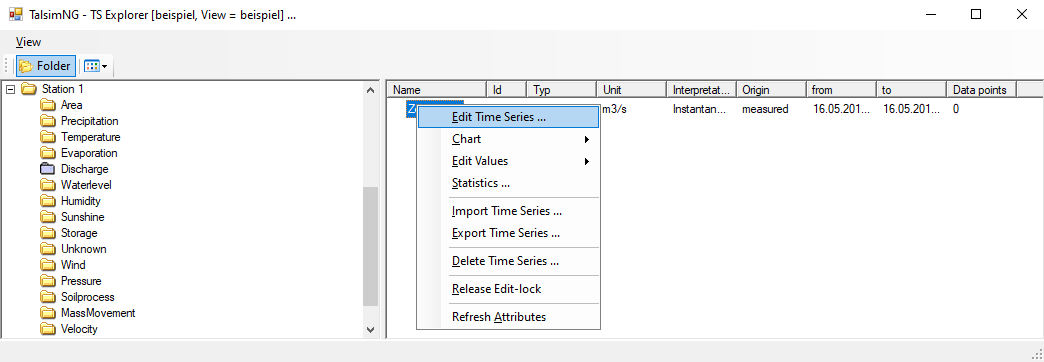
You can use the following buttons if you right-click on the time series in the explorer.
| Edit Time Series | The selected time series can be edited. |
| Chart | The time series can be displayed as a graph over time or as a duration curve. |
| Edit Values | Values with date are added to the selected time series. Values can also be edited or deleted. |
| Statistics | Calculates a statistical overview of the time series. |
| Import Time Series | An existing time series can be imported. |
| Export Time Series | The selected time series can be exported. |
| Delete Time Series | The selected time series is deleted. This operation cannot be undone. |
| Release Edit-lock | Releases the edit-lock of the time series, so it can be edited by another user.. |
| Refresh Attributes | After adjusting the attributes of a time series, those attributes are updated in the explorer. |
Edit Time Series
To adjust the attributes of a time series, right-click on Time Series → Edit Time Series in the time series manager.
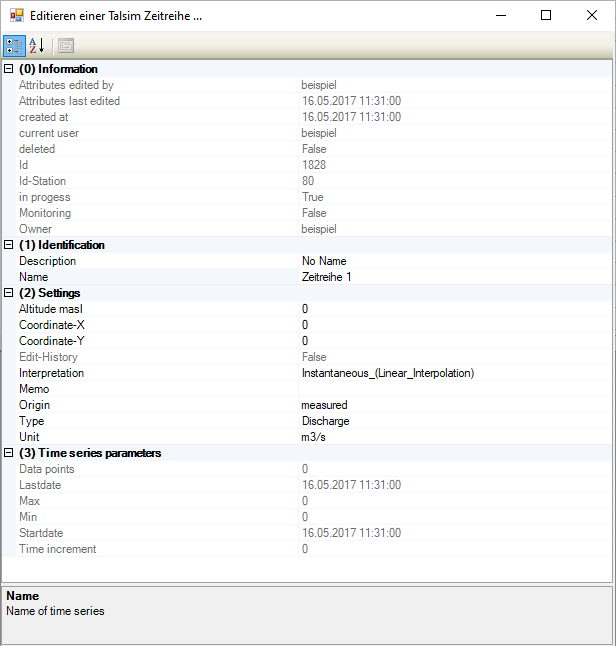
The following dialog window, where you can edit the attributes, opens. The attributes assigned to identification and settings, which are displayed in black, can be adjusted with a double-click. By clicking OK all time series attributes can be saved.
| Identification | Description | Description of the time series |
| Name | Name of the time series | |
| Settings | Altitude masl | Height of the measuring station in meters above sea level |
| Coordinate-X | X-coordinate of the measuring station | |
| Coordinate-Y | Y-coordinate of the measuring station | |
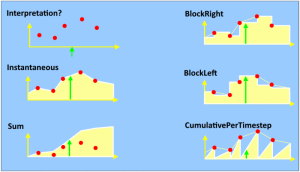
| Interpretation | Information about the time series values, i.e. how to understand the timestamp and the value stored in it. Caution: wrongly defined interpretations inevitably lead to incorrect results.
Choice of:
| |
| Memo | Description of the origin of the time series and other additional information | |
| Origin | Origin of the time series
Choice of:
| |
| Type | Hydrological, hydrometeorological, storage-dependent or geological variable
With this setting the time series is assigned to one of the 15 subfolders of the station. Choice of:
| |
| Unit | Unit of the variable
Choice of: ?,empty, number, class, mm/m, percent, h/d, 0/00, ml/l, mm, m, cm, km, hm, dm, l/ha, l/km², l/m², mNN, m², km², ha, cm², mm², dm², m³/m, m³, Tsd. m³, Mio. m³, l, hl, km³, cm³, mm³, m/s, mm/d, mm/h, mm/min, l/s/km², m/h, m/d, l/s/ha, m/s², m³/s, l/s, m³/d, m³/h, l/h, l/d, °C, kg, g, mg, t, s, min, h, d, w, mon, a, Datum, A, bar, pa, hpa, Grad, Rad, kg/m³, mg/l, g/l, l/kg, ml/g, Grad_C, kg/s, y/n |
Time Series Values
After a new time series is created and edited, values can be added to it. To do this, right-click on the Time Series → Edit Value. If a time series with values already exists, the values can be edited or deleted.
You can use the following buttons:
| Edit | Selected values of the time series can be edited. |
| Add | Values can be added to the time series. |
| Delete | Selected values of the time series can be deleted. This operation cannot be undone. |
Add Values to Time Series
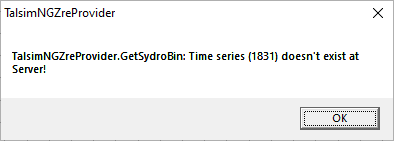
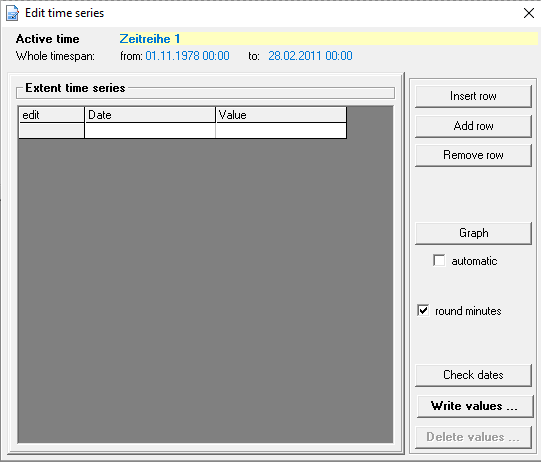
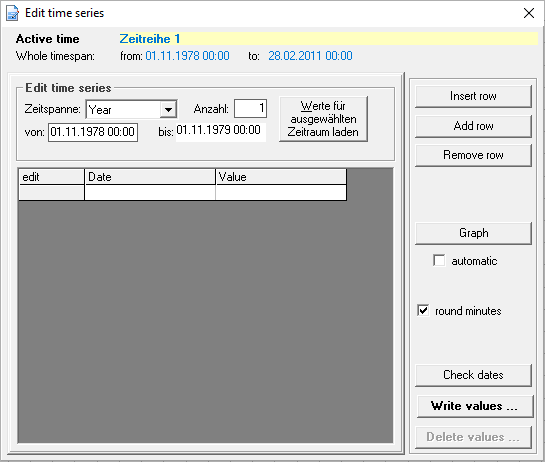
To add new values to the time series, click on add. The following TalsimNGZreProvider window opens. This indicates that the time series does not contain any values yet, and is, therefore, not stored on the server on in the database. By clicking OK the window for editing the time series values opens.
Here you can use the following buttons:
| Insert Row | A row is inserted above the selected cell. |
| Add Row | A row is added to the end of the time series. |
| Remove Row | The selected row is removed. |
| Graph | The time series is displayed graphically. |
| Check dates | The date of the time series is checked. This means that the date must be ascending in time. |
| Write values | The time series and its values are stored on the server and in the database. Additionally, a binary file, named after the ID of the time series, is created in the system data. |
| Delete values | All values are deleted. |
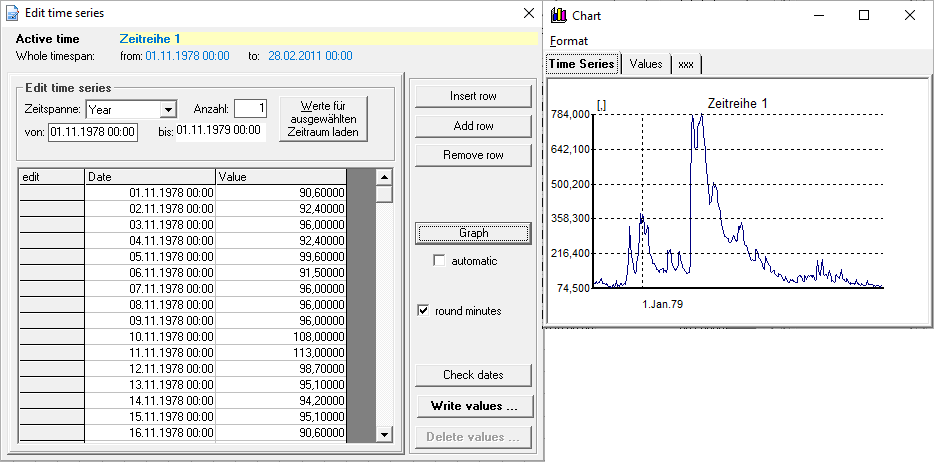
The 'Edit time series' window shows the active time series, as well as the date, which by default corresponds to the date of creating the time series, unless it has been manually changed. Here you can manually enter a date and its corresponding value. You can also copy a time series with dates and values e.g. from Excel and click on the first cell of the table and paste it there (key combination: Ctrl+V).
When the values are inserted, the time series can be displayed using Graph.
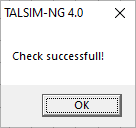
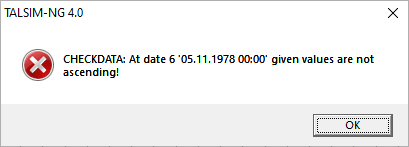
In the next step the date is checked. If the dates are ascending, a window with "Check successful!" will appear. Otherwise an error message will be displayed.
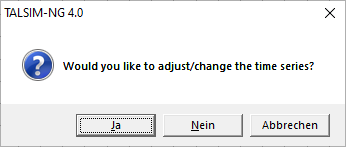
If all values are complete and the date is successfully checked, the values are written. In the appearing window, click Yes to confirm, No or Cancel to cancel.
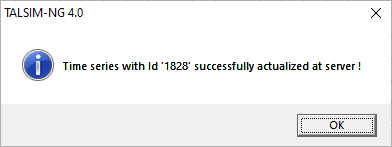
The implementation of the values into the time series has been successful if the following confirmation window appears. Completing this step, saves the time series in the time series database as well as in the system data as a binary file, and exports the time series to the server. The editing window can now be closed.
Edit Values of the Time Series
Time series can be edited by right-clicking on the Time Series → Edit Values → Edit. The active time series and its appropriate date is displayed. Now you can select the time period for which you want to make changes to load it into the edit window. The data will be displayed accordingly. With the other buttons you can edit the time series as described under Add Values to Time Series.
Display Time Series Graphically
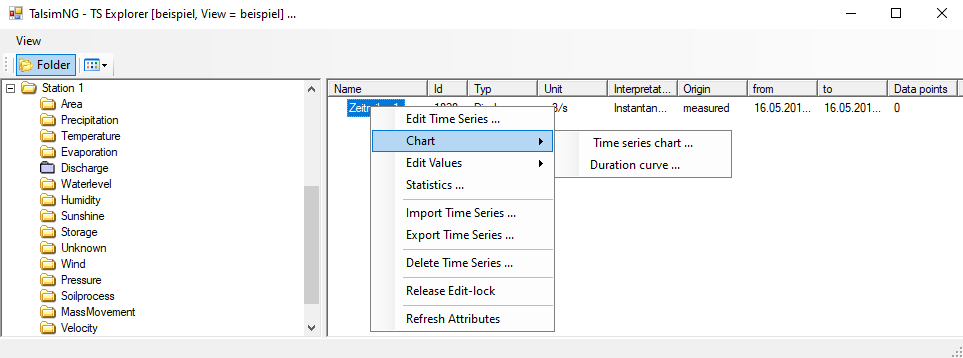
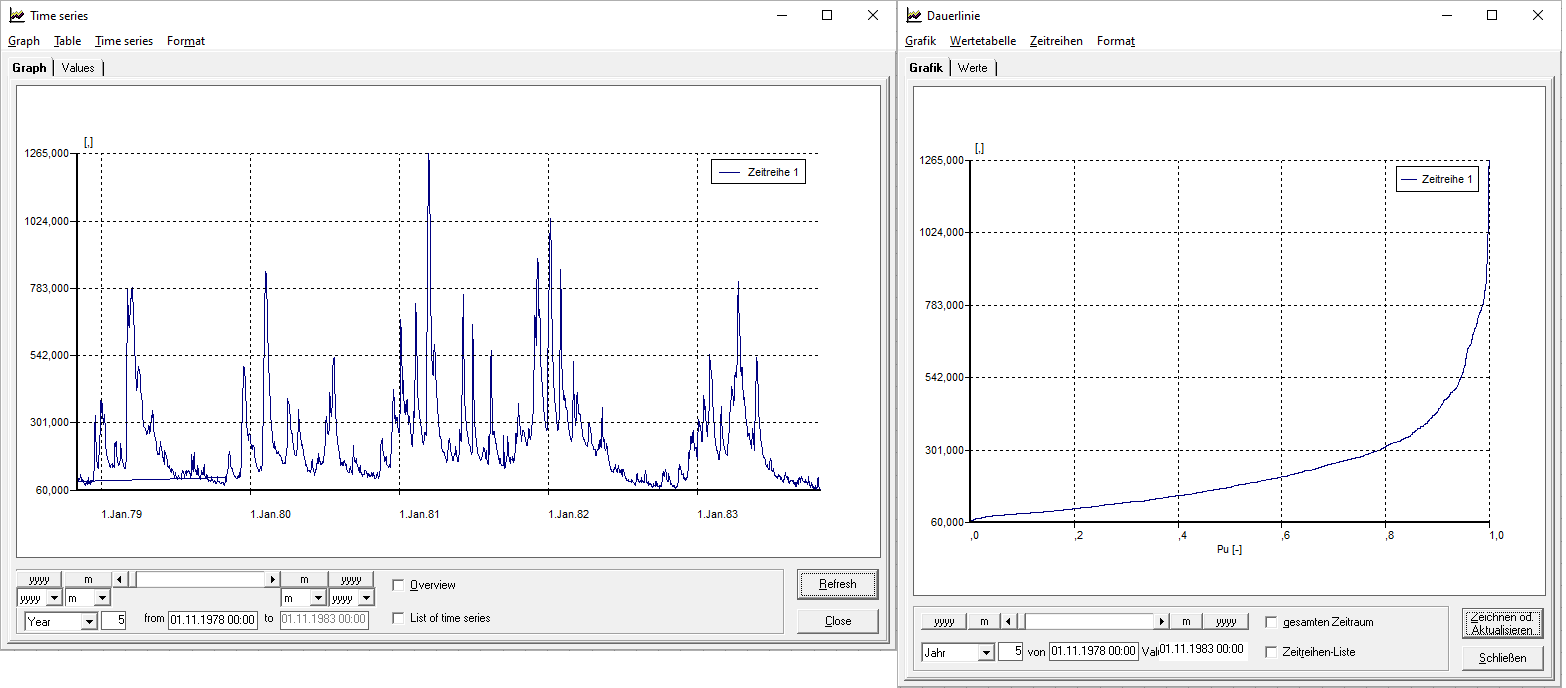
A time series can be displayed graphically by right-clicking on Time Series → Charts. You have the choice between a hydrograph (Time series chart) and a duration curve.
Evaluate Time Series Statistically
Right-clicking Time Series → Statistics opens a statistics tool with which you can calculate severlal statistical measures for a predefined period. Furthermore, you can perform a low water or flood analysis. The results are displayed once you click on Calculate after entering the required data.

