Speicherfenster/en: Unterschied zwischen den Versionen
Ferrao (Diskussion | Beiträge) (Die Seite wurde neu angelegt: „An already created boundary can be edited by double-clicking on the box with the identifier in the Boundaries area or by right-clicking on the identifier -> ''…“) |
Ferrao (Diskussion | Beiträge) (Die Seite wurde neu angelegt: „Here the minimum permissible discharge through the facility can be entered. After clicking the ''Function'' button, the content discharge function can also be…“) |
||
| Zeile 186: | Zeile 186: | ||
[[Datei:Speicher_Fenster_Grenze.PNG|Datei:Speicher_Fenster_Grenze.PNG]] | [[Datei:Speicher_Fenster_Grenze.PNG|Datei:Speicher_Fenster_Grenze.PNG]] | ||
Here the minimum permissible discharge through the facility can be entered. | |||
After clicking the ''Function'' button, the content discharge function can also be entered as a limit function. | |||
Version vom 4. Januar 2021, 14:48 Uhr
The data sheet for the memory can be opened by double clicking on the element symbol in the system plan 30px or by right clicking -> Data sheet.
It has the two tabs Properties and Simulation Settings.
Properties
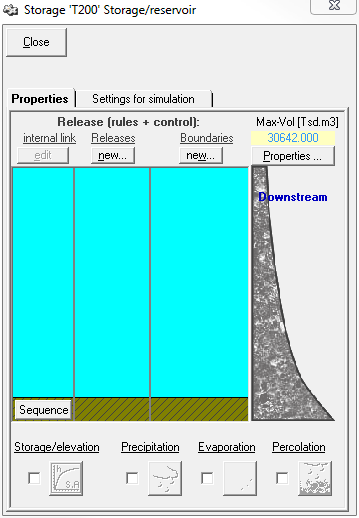
right The Properties tab of the storage element is divided into different areas (from top left to bottom right):
- internal dependencies
- levies
- limits
- master data
- sequences
- storage curves
- loss/grant (precipitation, evaporation, infiltration)
In the following, these are discussed in the order in which they are usefully processed.
Master data
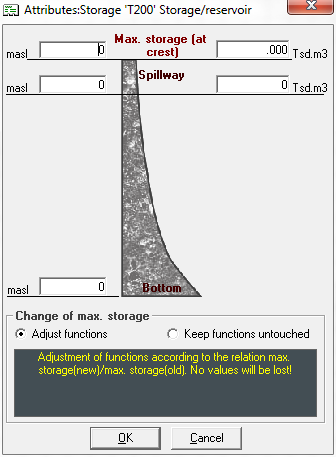
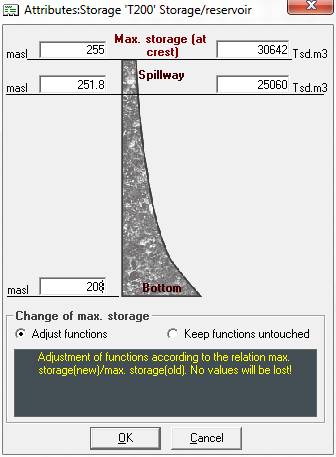
The first time you create a new system element reservoir, a window with the master data of the memory appears. Later, the window can be opened by clicking the button Master data in the upper right corner of the storage tank window. Here the most important characteristics of the memory should be entered.
The terms are oriented towards dams, since the system element was originally developed as a pure dam element. For dams, the height and the content are entered for the following positions:
- Bottom (content=0)
- Flood discharge
- Crown (maximum content)
For all other memories, instead of the content at crown height, a fictitious value can be specified as maximum content, which is never exceeded in the model.
It is helpful to fill in the master data right at the beginning and to adjust all other functions to be entered in the storage element (e.g. storage characteristic curve, or function of the flood discharge) exactly to this master data. If the maximum content is changed afterwards, you can choose from two options at the bottom of the window how to proceed with the other functions of the storage element. There is the possibility to adjust the function values of all functions according to the percentage change of the maximum content. The other option is to keep the function values. In this way, all interpolation points that are larger than the new maximum content are discarded. In both cases it is important to check all functions!
Storage curve
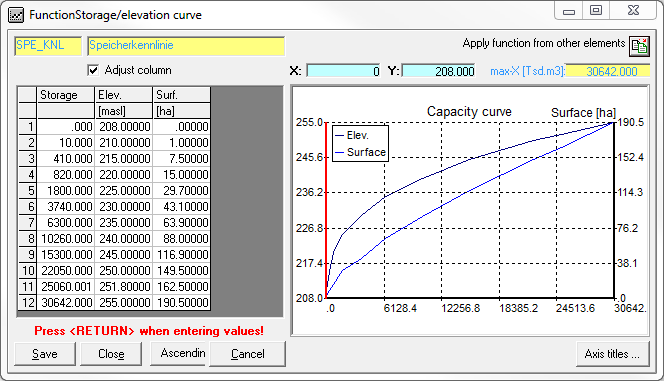
After entering the master data, it makes sense to enter the storage characteristic curve next. To do this, activate the checkbox next to the (initially grayed out) symbol for the storage characteristic at the bottom left of the window. Later, the storage characteristics can be edited by clicking the
icon. Deactivating the check box deletes the storage characteristic curve again.
The storage characteristic curve compares the content of the storage tank with the respective water levels and the surface. When entering the data, it is important to note that the height and content data must be consistent with the positions for the river bed, spillway and crown that have been entered in the master data sheet. The first grid point is always content: 0 | height: sole height | surface: 0. The last grid point is content: maximum content | height: crown height | surface: corresponding maximum surface.
Release
Create new release
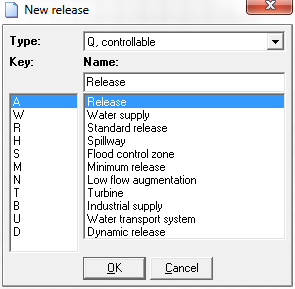
To create a new delivery, click the button Create new delivery in the area Deliveries of the memory window. Afterwards a window appears, in which the class and the type of the delivery can be selected and a designation can be assigned.
The class of the delivery can be chosen between Q, adjustable delivery and K, non adjustable delivery. The following options are available for the type of levy:
| Kennung | Standardbezeichung EN | Bezeichnung DE |
|---|---|---|
| A | Release | Abgabe |
| W | Water supply | Wasserversorgung |
| R | Standard release | Regelabgabe |
| H | Spillway | Hochwasserentlastung |
| S | Flood control zone | Hochwasserschutzraum |
| M | Minimum release | Mindestabgabe |
| N | Low flow augmentation | Niedrigwasseraufhöhung |
| T | Turbine | Turbine |
| B | Industrial supply | Brauchwasser |
| U | Water transport system | Überleitung |
| D | Dynamic release | Dynamische Abgabe |
The selection of type, class and the input of the designation is mainly informative. The user himself is responsible for entering the data for delivery afterwards. The identification of the levy is made up of three digits: the first letter is determined by the selected class, the second by the selected type, followed by a unique number in the third position, which is assigned in the order in which the levy of the respective class and type is created. The charge identification determines how the simulation results are stored and how the charges can be addressed for the definition of system states. For this purpose, the delivery identifier is appended to the respective system element identifier with underscore, e.g., T100_QA1.
After the delivery has been created, a box with the respective delivery identification appears in the memory window in the area Deliveries.
Edit submission
An already created levy can be edited by double clicking on the box with the levy ID in the Levy section or by right clicking on the box -> edit. A new window opens.
Enable/disable output
To the left of the box with the delivery ID there is a checkbox that can be used to activate and deactivate the delivery. Disabled dispensers are not taken into account in the simulation.
Clear submission
A delivery can be deleted by right-clicking on the identifier to open the context menu and selecting delete.
Abläufe
Newly created memory outputs do not yet have an output from the memory. Therefore an allocation to an outlet has to be established first. If the memory element in the system plan is already connected to other system elements connected elements, these elements appear with their identifier in the Sequences area on the right side of the window. A delivery is now assigned to a schedule by connecting them via drag&drop. To do this, drag the box with the ID of the delivery with the left mouse button pressed down onto the box with the ID of the schedule. The created connection is displayed with an arrow. Similarly, an existing connection can be deleted. A run can contain several deliveries.
Limits
Create new limits
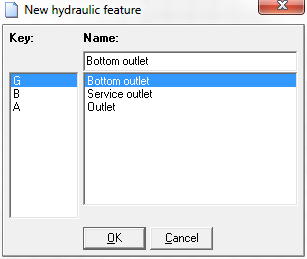
To create a new limit for an operating device, click the button Create new limit in the memory window in the Limits area. After that a window appears in which the identification of the border can be selected and a name assigned.
The following options are available for the type of limit of the operating equipment:
| Kennung | Standardbezeichung EN | Bezeichnung DE |
|---|---|---|
| G | Bottom outlet | Grundablass |
| B | Service outlet | Betriebsablass |
| A | Outlet | Auslass |
The selection of the type and the input of the designation is mainly informative and does not affect the calculation. The identification of the boundary is made up of three digits: the first letter is always "G", the second is determined by the selected type, followed by a unique number at the third position, which is assigned in the order in which the boundaries of the respective type are created.
After the limit has been created, a box with the respective identification of the limit appears in the memory window in the area Limits.
Edit limits
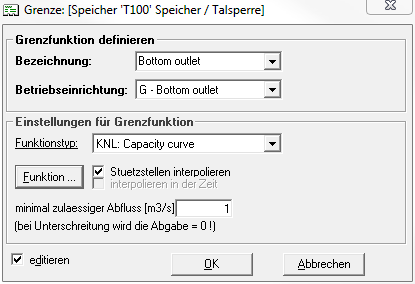
An already created boundary can be edited by double-clicking on the box with the identifier in the Boundaries area or by right-clicking on the identifier -> edit. A new window opens for this purpose:
Here the minimum permissible discharge through the facility can be entered. After clicking the Function button, the content discharge function can also be entered as a limit function.
Abgabe einer Grenze zuordnen/ Zuordnung löschen
Eine Abgabe kann einer Grenze per Drag&Drop zugeordnet werden. Dazu wird das Kästchen mit der Kennung der Abgabe auf das Kästchen mit der Kennung der Grenze gezogen. Die Verbindung wird mit einem Pfeil dargestellt. Analog kann die Verbindung wieder gelöscht werden.

Grenze löschen
Um eine Grenze zu löschen wird per Rechtsklick auf die Grenze aus dem Kontextmenü -> löschen ausgewählt.
Interne Abhängigkeiten
Neue interne Abhängigkeit anlegen
Um eine neue interne Abhängigkeit zwischen zwei Abgaben anzulegen, verbindet man die beiden Abgaben per Drag&Drop. Dabei zieht man das Kästchen mit der Kennung der Abgabe, die die Bedingung für die Reduktion liefern soll, auf das Kästchen mit der Kennung der Abgabe, die reduziert werden soll. Die Verbindung wird mit einem Pfeil dargestellt. Eine Abgabe kann mehrere andere Abgaben reduzieren, dazu werden von dieser Abgabe mehrere Verbindungen erstellt.
Interne Abhängigkeit bearbeiten
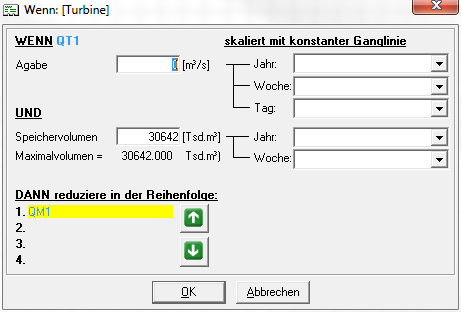
Um eine bereits angelegte interne Abhängigkeit zu bearbeiten, markiert man zunächst die Abgabe, die die Bedingung für die Reduktion liefern soll und klickt anschließend den Button Int. Abhängigkeit editieren . Alternativ kann nach Rechtsklick auf die Abgabe aus dem Kontextmenü -> interne Abhängigkeit bearbeiten ausgewählt werden. Danach erscheint ein Fenster
In dem erscheinenden Fenster kann eingegeben werden welchen Wert die Abgabe überschreiten und der Speicherinhalt unterschreiten muss, um eine Reduktion der anderen Abgaben auszulösen. Die Angabe erfolgt als konstanter Wert, ggf. skaliert mit einer konstanten Ganglinie, die aus den enstprechenden Dropdown-Listen ausgwählt werden kann. Unten im Fenster kann über die Pfeil-Buttons die Reihenfolge, in der die Abgaben reduziert werden sollen, verändert werden.
Die Reihenfolge, in der die Abgaben reduziert werden sollen kann außerdem in dem Fenster angepasst werden, das sich öffnet wenn man aus dem Speicherfenster heraus den Button Abfolge klickt.
Verlust/ Zuschuss
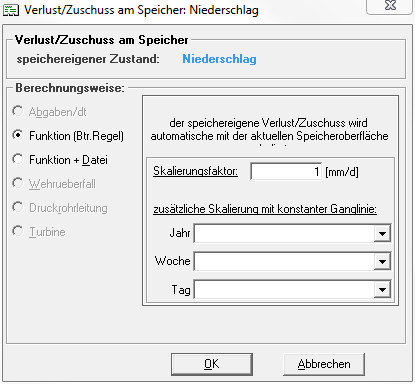
Zuschüsse/ Verluste am Speicher in Form von Niederschlag, Verdunstung und Versickerung können im unteren Bereich des Speicherfensters eingegeben werden. Dazu wird das Kontrollkästchen neben dem jeweiligen Symbol aktiviert und ein neues Fenster erscheint. Dieses Fenster kann später auch geöffnet werden, indem auf das Symbol des Verlusts/des Zuschusses geklickt wird.
Berechnungsweise
Der Verlust-/Zuschussterm kann entweder als konstante Ganglinie (Achtung: Bezeichnung in der GUI: Funktion (Btr.Regel)) eingegeben werden oder als Zeitreihe (Achtung: Bezeichnung in der GUI: Funktion + Datei), ggf. skaliert mit einem Faktor. Unabgängig von der gewählten Berechnungsweise, wird der speichereigene Verlust/Zuschuss automatisch mit der aktuellen Speicheroberfläche skaliert.
Simulationseinstellungen
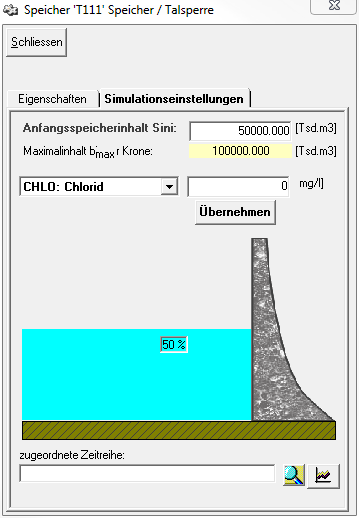
Im Reiter Simulationseinstellungen des Speicherfensters werden die Anfangsbedingungen für den Speicher festgelegt:
Der Anfangsspeicherinhalt [Tsd.m³] kann in ein Textfeld eingegeben werden. Zur Orientierung steht direkt darunter der Maximalinhalt des Speicherelements. Mit der Eingabe passt sich die Grafik mit dem Füllstand der Talsperre im mittleren Bereich des Fensters automatisch an und der Füllstand wird in Prozent ausgegeben.
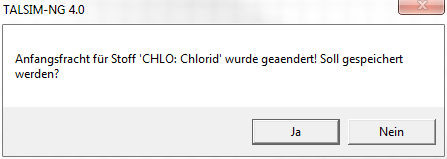
Für alle bereits definierten Stoffe wird hier ebenfalls die Anfangskonzentration [mg/l] angegeben. Dazu wird der Stoff aus der Dropdown-Liste ausgewählt und in dem Textfeld daneben die Anfangskonzentration eingegeben. Wichtig ist es danach den Button Übernehmen zu klicken , da sonst der Eintrag beim Schließen verloren geht. Wird der Button nach der Änderung nicht geklickt, erscheint zwar noch ein Meldungsfenster, aber der Ja-Knopf ist inaktiv, d.h. es wird nicht gespeichert.
Unten im Fenster gibt es noch die Möglichkeit den Startwert für den Inhalt aus einer Zeitreihe auszulesen. Der Wert in der Zeitreihe zu Simulationsbeginn wird als Startwert für den Anfangsinhalt gesetzt. Die Auswahl der Zeitreihe aus der Zeitreihenverwaltung erfolgt über den Button Auswahl ![]() . Über den Button Anzeigen
. Über den Button Anzeigen ![]() öffnet sich ein Fenster mit einer Grafik der Zeitreihe.
öffnet sich ein Fenster mit einer Grafik der Zeitreihe.
